← return to practice.dsc10.com
These problems are taken from past quizzes and exams. Work on them
on paper, since the quizzes and exams you take in this
course will also be on paper.
We encourage you to complete these
problems during discussion section. Solutions will be made available
after all discussion sections have concluded. You don’t need to submit
your answers anywhere.
Note: We do not plan to cover all of
these problems during the discussion section; the problems we don’t
cover can be used for extra practice.
You generate a three-digit number by randomly choosing each digit to be a number 0 through 9, inclusive. Each digit is equally likely to be chosen.
What is the probability you produce the number 027? Give your answer as a decimal number between 0 and 1 with no rounding.
Answer: 0.001
There is a \frac{1}{10} chance that we get 0 as the first random number, a \frac{1}{10} chance that we get 2 as the second random number, and a \frac{1}{10} chance that we get 7 as the third random number. The probability of all of these events happening is \frac{1}{10}*\frac{1}{10}*\frac{1}{10} = 0.001.
Another way to do this problem is to think about the possible outcomes. Any number from 000 to 999 is possible and all are equally likely. Since there are 1000 possible outcomes and the number 027 is just one of the possible outcomes, the probability of getting this outcome is \frac{1}{1000} = 0.001.
The average score on this problem was 92%.
What is the probability you produce a number with an odd digit in the middle position? For example, 250. Give your answer as a decimal number between 0 and 1 with no rounding.
Answer: 0.5
Because the values of the left and right positions are not important to us, think of the middle position only. When selecting a random number to go here, we are choosing randomly from the numbers 0 through 9. Since 5 of these numbers are odd (1, 3, 5, 7, 9), the probability of getting an odd number is \frac{5}{10} = 0.5.
The average score on this problem was 78%.
What is the probability you produce a number with a 7 in it somewhere? Give your answer as a decimal number between 0 and 1 with no rounding.
Answer: 0.271
It’s easier to calculate the probability that the number has no 7 in it, and then subtract this probability from 1. To solve this problem directly, we’d have to consider cases where 7 appeared multiple times, which would be more complicated.
The probability that the resulting number has no 7 is \frac{9}{10}*\frac{9}{10}*\frac{9}{10} = 0.729 because in each of the three positions, there is a \frac{9}{10} chance of selecting something other than a 7. Therefore, the probability that the number has a 7 is 1 - 0.729 = 0.271.
The average score on this problem was 69%.
Suppose you are booking a flight and you have no control over which airline you fly on. Below is a table with multiple airlines and the probability of a flight being on a specific airline.
| Airline | Chance |
|---|---|
| Delta | 0.4 |
| United | 0.3 |
| American | 0.2 |
| All other airlines | 0.1 |
The airline for one flight has no impact on the airline for another flight.
For this question, suppose that you schedule 3 flights for January 2022.
What is the probability that all 3 flights are on United? Give your answer as an exact decimal between 0 and 1 (not a Python expression).
Answer: 0.027
For all three flights to be on United, we need the first flight to be on United, and the second, and the third. Since these are independent events that do not impact one another, and we need all three flights to separately be on United, we need to multiply these probabilities, giving an answer of 0.3*0.3*0.3 = 0.027.
Note that on an exam without calculator access, you could leave your answer as (0.3)^3.
The average score on this problem was 93%.
What is the probability that all 3 flights are on Delta, or all on United, or all on American? Give your answer as an exact decimal between 0 and 1 (not a Python expression).
Answer: 0.099
We already calculated the probability of all three flights being on United as (0.3)^3 = 0.027. Similarly, the probability of all three flights being on Delta is (0.4)^3 = 0.064, and the probability of all three flights being on American is (0.2)^3 = 0.008. Since we cannot satisfy more than one of these conditions at the same time, we can separately add their probabilities to find a total probability of 0.027 + 0.064 + 0.008 = 0.099.
The average score on this problem was 76%.
True or False: The probability that all 3 flights are on the same airline is equal to the probability you computed in the previous subpart.
True
False
Answer: False
It’s not quite the same because the previous subpart doesn’t include the probability that all three flights are on the same airline which is not one of Delta, United, or American. For example, there is a small probability that all three flights are on Allegiant or all three flights are on Southwest.
The average score on this problem was 90%.
King Triton has boarded a Southwest flight. For in-flight refreshments, Southwest serves four types of cookies – chocolate chip, gingerbread, oatmeal, and peanut butter.
The flight attendant comes to King Triton with a box containing 10 cookies:
The flight attendant tells King Triton to grab 2 cookies out of the box without looking.
Fill in the blanks below to implement a simulation that estimates the probability that both of King Triton’s selected cookies are the same.
# 'cho' stands for chocolate chip, 'gin' stands for gingerbread,
# 'oat' stands for oatmeal, and 'pea' stands for peanut butter.

cookie_box = np.array(['cho', 'cho', 'cho', 'cho', 'gin',
                       'gin', 'gin', 'oat', 'oat', 'pea'])

repetitions = 10000
prob_both_same = 0
for i in np.arange(repetitions):
    grab = np.random.choice(__(a)__)
    if __(b)__:
        prob_both_same = prob_both_same + 1
prob_both_same = __(c)__What goes in blank (a)?
cookie_box, repetitions, replace=False
cookie_box, 2, replace=True
cookie_box, 2, replace=False
cookie_box, 2
Answer:
cookie_box, 2, replace=False
We are told that King Triton grabs two cookies out of the box without
looking. Since this is a random choice, we use the function
np.random.choice to simulate this. The first input to this
function is a sequence of values to choose from. We already have an
array of values to choose from in the variable cookie_box.
Calling np.random.choice(cookie_box) would select one
cookie from the cookie box, but we want to select two, so we use an
optional second parameter to specify the number of items to randomly
select. Finally, we should consider whether we want to select with or
without replacement. Since cookie_box contains individual
cookies and King Triton is selecting two of them, he cannot choose the
same exact cookie twice. This means we should sample without
replacement, by specifying replace=False. Note that
omitting the replace parameter would use the default option
of sampling with replacement.
The average score on this problem was 92%.
What goes in blank (b)?
Answer: grab[0] == grab[1]
The idea of a simulation is to do some random process many times. We
can use the results to approximate a probability by counting up the
number of times some event occurred, and dividing that by the number of
times we did the random process. Here, the random process is selecting
two cookies from the cookie box, and we are doing this 10,000 times. The
approximate probability will be the number of times in which both
cookies are the same divided by 10,000. So we need to count up the
number of times that both randomly selected cookies are the same. We do
this by having an accumulator variable that starts out at 0 and gets
incremented, or increased by 1, every time both cookies are the same.
The code has such a variable, called prob_both_same, that
is initialized to 0 and gets incremented when some condition is met.
We need to fill in the condition, which is that both randomly
selected cookies are the same. We’ve already randomly selected the
cookies and stored the results in grab, which is an array
of length 2 that comes from the output of a call to
np.random.choice. To check if both elements of the
grab array are the same, we access the individual elements
using brackets with the position number, and compare using the
== symbol to check equality. Note that at the end of the
for loop, the variable prob_both_same will
contain a count of the number of trials out of 10,000 in which both of
King Triton’s cookies were the same flavor.
The average score on this problem was 79%.
What goes in blank (c)?
prob_both_same / repetitions
prob_both_same / 2
np.mean(prob_both_same)
prob_both_same.mean()
Answer:
prob_both_same / repetitions
After the for loop, prob_both_same contains
the number of trials out of 10,000 in which both of King Triton’s
cookies were the same flavor. We’d like it to represent the approximate
probability of both cookies being the same flavor, so we need to divide
the current value by the total number of trials, 10,000. Since this
value is stored in the variable repetitions, we can divide
prob_both_same by repetitions.
The average score on this problem was 93%.
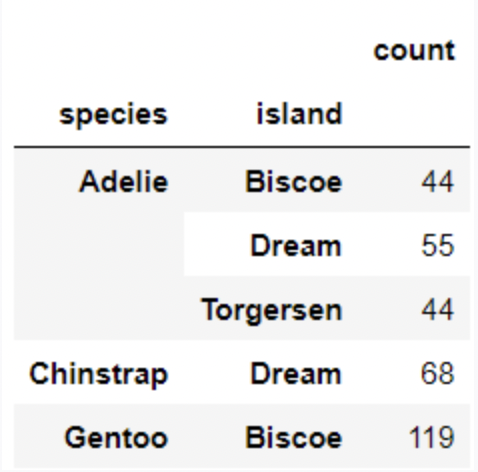
Each individual penguin in our dataset is of a certain species (Adelie, Chinstrap, or Gentoo) and comes from a particular island in Antarctica (Biscoe, Dream, or Torgerson). There are 330 penguins in our dataset, grouped by species and island as shown below.
Suppose we pick one of these 330 penguins, uniformly at random, and name it Chester.
What is the probability that Chester comes from Dream island? Give your answer as a number between 0 and 1, rounded to three decimal places.
Answer: 0.373
P(Chester comes from Dream island) = # of penguins in dream island / # of all penguins in the data = \frac{55+68}{330} \approx 0.373
The average score on this problem was 94%.
If we know that Chester comes from Dream island, what is the probability that Chester is an Adelie penguin? Give your answer as a number between 0 and 1, rounded to three decimal places.
Answer: 0.447
P(Chester is an Adelie penguin given that Chester comes from Dream island) = # of Adelie penguins from Dream island / # of penguins from Dream island = \frac{55}{55+68} \approx 0.447
The average score on this problem was 91%.
If we know that Chester is not from Dream island, what is the probability that Chester is not an Adelie penguin? Give your answer as a number between 0 and 1, rounded to three decimal places.
Answer: 0.575
Method 1
P(Chester is not an Adelie penguin given that Chester is not from Dream island) = # of penguins that are not Adelie penguins from islands other than Dream island / # of penguins in island other than Dream island = \frac{119\ \text{(eliminate all penguins that are Adelie or from Dream island, only Gentoo penguins from Biscoe are left)}}{44+44+119} \approx 0.575
Method 2
P(Chester is not an Adelie penguin given that Chester is not from Dream island) = 1- (# of penguins that are Adelie penguins from islands other than Dream island / # of penguins in island other than Dream island) = 1-\frac{44+44}{44+44+119} \approx 0.575
The average score on this problem was 85%.
The fine print of the Sun God festival website says “Ticket does not
guarantee entry. Venue subject to capacity restrictions.” RIMAC field,
where the 2022 festival will be held, has a capacity of 20,000 people.
Let’s say that UCSD distributes 21,000 tickets to Sun God 2022 because
prior data shows that 5% of tickets distributed are never actually
redeemed. Let’s suppose that each person with a ticket this year has a
5% chance of not attending (independently of all others). What is the
probability that at least one student who has a ticket cannot get in due
to the capacity restriction? Fill in the blanks in the code below so
that prob_angry_student evaluates to an approximation of
this probability.
num_angry = 0

for rep in np.arange(10000):
    # randomly choose 21000 elements from [True, False] such that
    # True has probability 0.95, False has probability 0.05
    attending = np.random.choice([True, False], 21000, p=[0.95, 0.05])
    if __(a)__:
        __(b)__

prob_angry_student = __(c)__What goes in the first blank?
np.count_nonzero(attending) == 20001
attending[20000] == False
attending.sum() > 20000
np.count_nonzero(attending) > num_angry
Answer: attending.sum() > 20000
Let’s look at the variable attending. Since we’re
choosing 21,000 elements from the list [True, False] and
there are 21,000 tickets distributed, this code is randomly determining
whether each ticket holder will actually attend the festival. There’s a
95% chance of each ticket holder attending, which is reflected in the
p=[0.95, 0.05] argument. Remember that
np.random.choice returns an array of random choices, which
in this case means it will contain 21,000 elements, each of which is
True or False.
We want to figure out the probability of at least one ticket holder
showing up and not being admitted. Another way to say this is we want to
find the probability that more than 20,000 ticket holders show up to
attend the festival. The way we approximate a probability through
simulation is we repeat a process many times and see how often some
event occurred. The event we’re interested in this case is that more
than 20,000 ticket holders came to Sun God. Since we have an array of
True and False values corresponding to whether
each ticket holder actually came, we just need to determine if there are
more than 20,000 True values in the attending
array.
There are several ways to count the number of True
values in a Boolean array. One way is to sum the array since in Python
True counts as 1 and False counts as 0.
Therefore, attending.sum() > 20000 is the condition we
need to check here.
The average score on this problem was 67%.
What goes in the second blank?
Answer: num_angry = num_angry + 1
Remember our goal in simulation is to repeat a process many times to
see how often some event occurs. The repetition comes from the
for loop which runs 10,000 times. Each time, we are
simulating the process of 21,000 students each randomly deciding whether
to show up to Sun God or not. We want to know, out of these 10,000
trials, how frequently more than 20,000 of the students will show up. So
when this happens, we want to record that it happened. The standard way
to do that is to keep a counter variable that starts at 0 and gets
incremented, or increased by one, each time we had more than 20,000
attendees in our simulation.
The framework to do this is already set up because a variable called
num_angry is initialized to 0 before the for
loop. This variable is our counter variable, meant to count the number
of trials, out of 10,000, that resulted in at least one student being
angry because they showed up to Sun God with a ticket and were denied
entrance. So all we need to do when there are more than 20,000
True values in the attending array is
increment this counter by one via the code
num_angry = num_angry + 1, sometimes abbreviated as
num_angry += 1.
The average score on this problem was 59%.
What goes in the third blank?
Answer: num_angry/10000
To calculate the approximate probability, all we need to do is divide the number of trials in which a student was angry by the total number of trials, which is 10,000.
The average score on this problem was 68%.
You’re definitely going to Sun God 2022, but you don’t want to go alone! Fortunately, you have n friends who promise to go with you. Unfortunately, your friends are somewhat flaky, and each has a probability p of actually going (independent of all others). What is the probability that you wind up going alone? Give your answer in terms of p and n.
Answer: (1-p)^n
If you go alone, it means all of your friends failed to come. We can think of this as an and condition in order to use multiplication. The condition is: your first friend doesn’t come and your second friend doesn’t come, and so on. The probability of any individual friend not coming is 1-p, so the probability of all your friends not coming is (1-p)^n.
The average score on this problem was 76%.
In past Sun God festivals, sometimes artists that were part of the lineup have failed to show up! Let’s say there are n artists scheduled for Sun God 2022, and each artist has a probability p of showing up (independent of all others). What is the probability that the number of artists that show up is less than n, meaning somebody no-shows? Give your answer in terms of p and n.
Answer: 1-p^n
It’s actually easier to figure out the opposite event. The opposite of somebody no-showing is everybody shows up. This is easier to calculate because we can think of it as an and condition: the first artist shows up and the second artist shows up, and so on. That means we just multiply probabilities. Therefore, the probability of all artists showing up is p^n and the probability of some artist not showing up is 1-p^n.
The average score on this problem was 73%.
True or False: If you roll two dice, the probability of rolling two fives is the same as the probability of rolling a six and a three.
Answer: False
The probability of rolling two fives can be found with 1/6 * 1/6 = 1/36. The probability of rolling a six and a three can be found with 2/6 (can roll either a 3 or 6) * 1/6 (roll a different side from 3 or 6, depending on what you rolled first) = 1/18. Therefore, the probabilities are not the same.
The average score on this problem was 33%.
The HAUGA bedroom furniture set includes two items, a bed frame and a bedside table. Suppose the amount of time it takes someone to assemble the bed frame is a random quantity drawn from the probability distribution below.
| Time to assemble bed frame | Probability |
|---|---|
| 10 minutes | 0.1 |
| 20 minutes | 0.4 |
| 30 minutes | 0.5 |
Similarly, the time it takes someone to assemble the bedside table is a random quantity, independent of the time it takes them to assemble the bed frame, drawn from the probability distribution below.
| Time to assemble bedside table | Probability |
|---|---|
| 30 minutes | 0.3 |
| 40 minutes | 0.4 |
| 50 minutes | 0.3 |
What is the probability that Stella assembles the bed frame in 10 minutes if we know it took her less than 30 minutes to assemble? Give your answer as a decimal between 0 and 1.
Answer: 0.2
We want to find the probability that Stella assembles the bed frame in 10 minutes, given that she assembles it in less than 30 minutes. The multiplication rule can be rearranged to find the conditional probability of one event given another.
\begin{aligned} P(A \text{ and } B) &= P(A \text{ given } B)*P(B)\\ P(A \text{ given } B) &= \frac{P(A \text{ and } B)}{P(B)} \end{aligned}
Let’s, therefore, define events A and B as follows:
Since 10 minutes is less than 30 minutes, A \text{ and } B is the same as A in this case. Therefore, P(A \text{ and } B) = P(A) = 0.1.
Since there are only two ways to complete the bed frame in less than 30 minutes (10 minutes or 20 minutes), it is straightforward to find P(B) using the addition rule P(B) = 0.1 + 0.4. The addition rule can be used here because assembling the bed frame in 10 minutes and assembling the bed frame in 20 minutes are mutually exclusive. We could alternatively find P(B) using the complement rule, since the only way not to complete the bed frame in less than 30 minutes is to complete it in exactly 30 minutes, which happens with a probability of 0.5. We’d get the same answer, P(B) = 1 - 0.5 = 0.5.
Plugging these numbers in gives our answer.
\begin{aligned} P(A \text{ given } B) &= \frac{P(A \text{ and } B)}{P(B)}\\ &= \frac{0.1}{0.5}\\ &= 0.2 \end{aligned}
The average score on this problem was 72%.
What is the probability that Ryland assembles the bedside table in 40 minutes if we know that it took him 30 minutes to assemble the bed frame? Give your answer as a decimal between 0 and 1
Answer: 0.4
We are told that the time it takes someone to assemble the bedside table is a random quantity, independent of the time it takes them to assemble the bed frame. Therefore we can disregard the information about the time it took him to assemble the bed frame and read directly from the probability distribution that his probability of assembling the bedside table in 40 minutes is 0.4.
The average score on this problem was 82%.
What is the probability that Jin assembles the complete HAUGA set in at most 60 minutes? Give your answer as a decimal between 0 and 1.
Answer: 0.53
There are several different ways for the total assembly time to take at most 60 minutes:
Using the multiplication rule, these probabilities are:
Finally, adding them up because they represent mutually exclusive cases, we get 0.1+0.28+0.15 = 0.53.
The average score on this problem was 58%.
King Triton had four children, and each of his four children started their own families. These four families organize a Triton family reunion each year. The compositions of the four families are as follows:
Family W: "1a4c"
Family X: "2a1c"
Family Y: "2a3c"
Family Z: "1a1c"
Suppose we choose one of the fifteen people at the Triton family reunion at random.
Given that the chosen individual is from a family with one child, what is the probability that they are from Family X? Give your answer as a simplified fraction.
Answer: \frac{3}{5}
Given that the chosen individual is from a family with one child, we know that they must be from either Family X or Family Z. There are three individuals in Family X, and there are a total of five individuals from these two families. Thus, the probability of choosing any one of the three individuals from Family X out of the five individuals from both families is \frac{3}{5}.
The average score on this problem was 43%.
Consider the events A and B, defined below.
A: The chosen individual is an adult.
B: The chosen individual is a child.
True or False: Events A and B are independent.
True
False
Answer: False
If two events are independent, knowledge of one event happening does not change the probability of the other event happening. In this case, events A and B are not independent because knowledge of one event gives complete knowledge of the other.
To see this, note that the probability of choosing a child randomly out of the fifteen individuals is \frac{9}{15}. That is, P(B) = \frac{9}{15}.
Suppose now that we know that the chosen individual is an adult. In this case, the probability that the chosen individual is a child is 0, because nobody is both a child and an adult. That is, P(B \text{ given } A) = 0, which is not the same as P(B) = \frac{9}{15}.
This problem illustrates the difference between mutually exclusive events and independent events. In this case A and B are mutually exclusive, because they cannot both happen. But that forces them to be dependent events, because knowing that someone is an adult completely determines the probability that they are a child (it’s zero!)
The average score on this problem was 33%.
Consider the events C and D, defined below.
C: The chosen individual is a child.
D: The chosen individual is from family Y.
True or False: Events C and D are independent.
True
False
Answer: True
If two events are independent, the probability of one event happening does not change when we know that the other event happens. In this case, events C and D are indeed independent.
If we know that the chosen individual is a child, the probability that they come from Family Y is \frac{3}{9}, which simplifies to \frac{1}{3}. That is P(D \text{ given } C) = \frac{1}{3}.
On the other hand, without any prior knowledge, when we select someone randomly from all fifteen individuals, the probability they come from Family Y is \frac{5}{15}, which also simplifies to \frac{1}{3}. This says P(D) = \frac{1}{3}.
In other words, knowledge of C is irrelevant to the probability of D occurring, which means C and D are independent.
The average score on this problem was 35%.
At the reunion, the Tritons play a game that involves placing the four letters into a hat (W, X, Y, and Z, corresponding to the four families). Then, five times, they draw a letter from the hat, write it down on a piece of paper, and place it back into the hat.
Let p = \frac{1}{4} in the questions that follow.
What is the probability that Family W is selected all 5 times?
p^5
1 - p^5
1 - (1 - p)^5
(1 - p)^5
p \cdot (1 - p)^4
p^4 (1 - p)
None of these.
Answer: p^5
The probability of selecting Family W in the first round is p, which is the same for the second round, the third round, and so on. Each of the chosen letters is drawn independently from the others because the result of one draw does not affect the result of the next. We can apply the multiplication rule here and multiply the probabilities of choosing Family W in each round. This comes out to be p\cdot p\cdot p\cdot p\cdot p, which is p^5.
The average score on this problem was 91%.
What is the probability that Family W is selected at least once?
p^5
1 - p^5
1 - (1 - p)^5
(1 - p)^5
p \cdot (1 - p)^4
p^4 (1 - p)
None of these.
Answer: 1 - (1 - p)^5
Since there are too many ways that Family W can be selected to meet the condition that it is selected at least once, it is easier if we calculate the probability that Family W is never selected and subtract that from 1. The probability that Family W is not selected in the first round is 1-p, which is the same for the second round, the third round, and so on. We want this to happen for all five rounds, and since the events are independent, we can multiply their probabilities all together. This comes out to be (1-p)^5, which represents the probability that Family W is never selected. Finally, we subtract (1-p)^5 from 1 to find the probability that Family W is selected at least once, giving the answer 1 - (1-p)^5.
The average score on this problem was 62%.
What is the probability that Family W is selected exactly once, as the last family that is selected?
p^5
1 - p^5
1 - (1 - p)^5
(1 - p)^5
p \cdot (1 - p)^4
p^4 (1 - p)
None of these.
Answer: p \cdot (1 - p)^4
We want to find the probability of Family W being selected only as the last draw, and not in the first four draws. The probability that Family W is not selected in the first draw is (1-p), which is the same for the second, third, and fourth draws. For the fifth draw, the probability of choosing Family W is p. Since the draws are independent, we can multiply these probabilities together, which comes out to be (1-p)^4 \cdot p = p\cdot (1-p)^4.
The average score on this problem was 67%.