← return to practice.dsc10.com
Instructor(s): Suraj Rampure, Janine Tiefenbruck
This exam was administered remotely via Gradescope. The exam was open-notes, and students could access any resource including the internet and Jupyter notebooks. Students had 50 minutes to work on it.
Note (groupby / pandas 2.0): Pandas 2.0+ no longer
silently drops columns that can’t be aggregated after a
groupby, so code written for older pandas may behave
differently or raise errors. In these practice materials we use
.get() to select the column(s) we want after
.groupby(...).mean() (or other aggregations) so that our
solutions run on current pandas. On real exams you will not be penalized
for omitting .get() when the old behavior would have
produced the same answer.
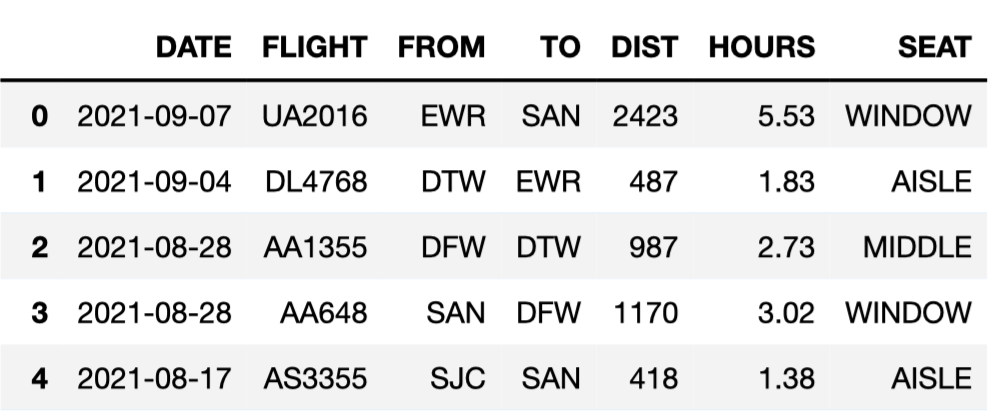
King Triton, UCSD’s mascot, is quite the traveler! Throughout this
exam, we will be working with the flights DataFrame, which
details several facts about each of the flights that King Triton has
been on over the past few years. The first few rows of
flights are shown below.
Here’s a description of the columns in flights:
'DATE': the date on which the flight occurred. Assume
that there were no “redeye” flights that spanned multiple days.'FLIGHT': the flight number. Note that this is not
unique; airlines reuse flight numbers on a daily basis.'FROM' and 'TO': the 3-letter airport code
for the departure and arrival airports, respectively. Note that it’s not
possible to have a flight from and to the same airport.'DIST': the distance of the flight, in miles.'HOURS': the length of the flight, in hours.'SEAT': the kind of seat King Triton sat in on the
flight; the only possible values are 'WINDOW',
'MIDDLE', and 'AISLE'.Tip: Open this page in another tab, so that it is easy to refer to this data description as you work through the exam.
Which of these would it make sense to use as the index of
flights?
'DATE'
'FLIGHT'
'FROM'
'TO'
None of these are good choices for the index
Answer: None of these are good choices for the index
When choosing an index, we have to make sure that the index is different for each row of the DataFrame. The index in this case should uniquely identify the flight.
'DATE'does not uniquely identify a flight because there
are many different flights in a single day. 'FLIGHT' does
not uniquely identify a flight because airlines reuse flight numbers on
a daily basis, as we are told in the data description. Neither
'FROM' nor 'TO' uniquely identifies a flight,
as there are many flights each day that depart from each airport and
arrive at each airport.
Therefore, there is no single column that’s sufficient to uniquely
identify a flight, but if we could use multiple columns to create what’s
called a multi-index, we’d probably want to use 'DATE' and
'FLIGHT' because each row of our DataFrame should have a
unique pair of values in these columns. That’s because airlines don’t
reuse flight numbers within a single day.
The average score on this problem was 57%.
What type of variable is 'FLIGHT'?
Categorical
Numerical
Answer: Categorical
'FLIGHT' is a categorical variable because it doesn’t
make sense to do arithmetic with the values in the 'FLIGHT'
column. 'FLIGHT' is just a label for each flight, and the
fact that it includes some numbers does not make it numerical. We could
have just as well used letter codes to distinguish flights.
The average score on this problem was 98%.
Which of these correctly evaluates to the number of flights King
Triton took to San Diego (airport code 'SAN')?
flights.loc['SAN'].shape[0]
flights[flights.get('TO') == 'SAN'].shape[0]
flights[flights.get('TO') == 'SAN'].shape[1]
len(flights.sort_values('TO', ascending=False).loc['SAN'])
Answer:
flights[flights.get('TO') == 'SAN'].shape[0]
The strategy is to create a DataFrame with only the flights that went
to San Diego, then count the number of rows. The first step is to query
with the condition flights.get('TO') == 'SAN' and the
second step is to extract the number of rows with
.shape[0].
Some of the other answer choices use .loc['SAN'] but
.loc only works with the index, and flights
does not have airport codes in its index.
The average score on this problem was 95%.
Fill in the blanks below so that the result also evaluates to the
number of flights King Triton took to San Diego (airport code
'SAN').
flights.groupby(__(a)__).count().get('FLIGHT').__(b)__ What goes in blank (a)?
'DATE'
'FLIGHT'
'FROM'
'TO'
What goes in blank (b)?
.index[0]
.index[-1]
.loc['SAN']
.iloc['SAN']
.iloc[0]
True or False: If we change .get('FLIGHT') to
.get('SEAT'), the results of the above code block will not
change. (You may assume you answered the previous two subparts
correctly.)
True
False
Answer: 'TO',
.loc['SAN'], True
The strategy here is to group all of King Triton’s flights according
to where they landed, and count up the number that landed in San Diego.
The expression flights.groupby('TO').count() evaluates to a
DataFrame indexed by arrival airport where, for any arrival airport,
each column has a count of the number of King Triton’s flights that
landed at that airport. To get the count for San Diego, we need the
entry in any column for the row corresponding to San Diego. The code
.get('FLIGHT') says we’ll use the 'FLIGHT'
column, but any other column would be equivalent. To access the entry of
this column corresponding to San Diego, we have to use .loc
because we know the name of the value in the index should be
'SAN', but we don’t know the row number or integer
position.
The average score on this problem was 89%.
Consider the DataFrame san, defined below.
san = flights[(flights.get('FROM') == 'SAN') & (flights.get('TO') == 'SAN')]Which of these DataFrames must have the same number
of rows as san?
flights[(flights.get('FROM') == 'SAN') and (flights.get('TO') == 'SAN')]
flights[(flights.get('FROM') == 'SAN') | (flights.get('TO') == 'SAN')]
flights[(flights.get('FROM') == 'LAX') & (flights.get('TO') == 'SAN')]
flights[(flights.get('FROM') == 'LAX') & (flights.get('TO') == 'LAX')]
Answer:
flights[(flights.get('FROM') == 'LAX') & (flights.get('TO') == 'LAX')]
The DataFrame san contains all rows of
flights that have a departure airport of 'SAN'
and an arrival airport of 'SAN'. But as you may know, and
as you’re told in the data description, there are no flights from an
airport to itself. So san is actually an empty DataFrame
with no rows!
We just need to find which of the other DataFrames would necessarily
be empty, and we can see that
flights[(flights.get('FROM') == 'LAX') & (flights.get('TO') == 'LAX')]
will be empty for the same reason.
Note that none of the other answer choices are correct. The first
option uses the Python keyword and instead of the symbol
&, which behaves unexpectedly but does not give an
empty DataFrame. The second option will be non-empty because it will
contain all flights that have San Diego as the departure airport or
arrival airport, and we already know from the first few rows of
flight that there are some of these. The third option will
contain all the flights that King Triton has taken from
'LAX' to 'SAN'. Perhaps he’s never flown this
route, or perhaps he has. This DataFrame could be empty, but it’s not
necessarily going to be empty, as the question requires.
The average score on this problem was 70%.
Fill in the blanks below so that the result is a DataFrame with the
same columns as flights plus a new column,
'SPEED', containing the average speed of each flight, in
miles per hour.
flights.__(a)__(SPEED=__(b)__)What goes in blank (a)?
groupby
assign
rename
drop
merge
Answer: assign
We want to add a new column, so we must use assign. We
can also tell that the answer will be assign because it’s
the only DataFrame method that takes an input of the form
SPEED=___. Remember that when using assign, we get to call
the new column anything we want, and we don’t use quotes around its
name.
The average score on this problem was 100%.
What goes in blank (b)?
Answer:
(flights.get('DIST') / flights.get('HOURS'))
In this blank, we’ll need a Series or array containing the average speed of each flight, in miles per hour.
To calculate the average speed of an individual flight in miles per
hour, we’d simply divide the total number of miles by the total amount
of time in hours. For example, a flight that travels 500 miles in one
hour travels at 500 miles per hour. Note that this is an
average speed; at some points of the journey, the plane may
have been moving faster than this speed, at other times slower. Because
we are calculating an average speed for the whole trip by simply
dividing, we don’t need to use .mean().
Once we know how to calculate the average speed for an individual
flight, we can do the same operation on each flight all at once using
Series arithmetic. flights.get('DIST') is a Series
containing the distances of each flight, and
flights.get('HOURS') is a Series containing the times of
each flight, in the same order. When we divide these two Series,
corresponding entries are divided and the result is a Series of average
speeds for each flight, as desired.
The average score on this problem was 93%.
We define the seasons as follows:
| Season | Month |
|---|---|
| Spring | March, April, May |
| Summer | June, July, August |
| Fall | September, October, November |
| Winter | December, January, February |
We want to create a function date_to_season that takes
in a date as formatted in the 'DATE' column of
flights and returns the season corresponding to that date.
Which of the following implementations of date_to_season
works correctly? Select all that apply.
Option 1:
def date_to_season(date):
    month_as_num = int(date.split('-')[1])
    if month_as_num >= 3 and month_as_num < 6:
        return 'Spring'
    elif month_as_num >= 6 and month_as_num < 9:
        return 'Summer'
    elif month_as_num >= 9 and month_as_num < 12:
        return 'Fall'
    else:
        return 'Winter'
Option 2:
def date_to_season(date):
    month_as_num = int(date.split('-')[1])
    if month_as_num >= 3 and month_as_num < 6:
        return 'Spring'
    if month_as_num >= 6 and month_as_num < 9:
        return 'Summer'
    if month_as_num >= 9 and month_as_num < 12:
        return 'Fall'
    else:
        return 'Winter'
Option 3:
def date_to_season(date):
    month_as_num = int(date.split('-')[1])
    if month_as_num < 3:
        return 'Winter'
    elif month_as_num < 6:
        return 'Spring'
    elif month_as_num < 9:
        return 'Summer'
    elif month_as_num < 12:
        return 'Fall'
    else:
        return 'Winter'
Option 1
Option 2
Option 3
None of these implementations of date_to_season work
correctly
Answer: Option 1, Option 2, Option 3
All three options start with the same first line of code:
month_as_num = int(date.split('-')[1]). This takes the
date, originally a string formatted such as '2021-09-07',
separates it into a list of three strings such as
['2021', '09', '07'], extracts the element in position 1
(the middle position), and converts it to an int such as 9.
Now we have the month as a number we can work with more easily.
According to the definition of seasons, the months in each season are as follows:
| Season | Month | month_as_num |
|---|---|---|
| Spring | March, April, May | 3, 4, 5 |
| Summer | June, July, August | 6, 7, 8 |
| Fall | September, October, November | 9, 10, 11 |
| Winter | December, January, February | 12, 1, 2 |
Option 1 correctly assigns months to seasons by checking if the month
falls in the appropriate range for 'Spring', then
'Summer', then 'Fall'. Finally, if all of
these conditions are false, the else branch will return the
correct answer of 'Winter' when month_as_num
is 12, 1, or 2.
Option 2 is also correct, and in fact, it does the same exact thing
as Option 1 even though it uses if where Option 1 used
elif. The purpose of elif is to check a
condition only when all previous conditions are false. So if we have an
if followed by an elif, the elif
condition will only be checked when the if condition is
false. If we have two sequential if conditions, typically
the second condition will be checked regardless of the outcome of the
first condition, which means two if statements can behave
differently than an if followed by an elif. In
this case, however, since the if statements cause the
function to return and therefore stop executing, the only
way to get to a certain if condition is when all previous
if conditions are false. If any prior if
condition was true, the function would have returned already! So this
means the three if conditions in Option 2 are equivalent to
the if, elif, elif structure of
Option 1. Note that the else case in Option 1 is reached
when all prior conditions are false, whereas the else in
Option 2 is paired only with the if statement immediately
preceding it. But since we only ever get to that third if
statement when the first two if conditions are false, we
still only reach the else branch when all three
if conditions are false.
Option 3 works similarly to Option 1, except it separates the months
into more categories, first categorizing January and February as
'Winter', then checking for 'Spring',
'Summer', and 'Fall'. The only month that
winds up in the else branch is December. We can think of
Option 3 as the same as Option 1, except the Winter months have been
separated into two groups, and the group containing January and February
is extracted and checked first.
The average score on this problem was 76%.
Assuming we’ve defined date_to_season correctly in the
previous part, which of the following lines of code correctly computes
the season for each flight in flights?
date_to_season(flights.get('DATE'))
date_to_season.apply(flights).get('DATE')
flights.apply(date_to_season).get('DATE')
flights.get('DATE').apply(date_to_season)
Answer:
flights.get('DATE').apply(date_to_season)
Our function date_to_season takes as input a single date
and converts it to a season. We cannot input a whole Series of dates, as
in the first answer choice. We instead need to apply the
function to the whole Series of dates. The correct syntax to do that is
to first extract the Series of dates from the DataFrame and then use
.apply, passing in the name of the function we wish to
apply to each element of the Series. Therefore, the correct answer is
flights.get('DATE').apply(date_to_season).
The average score on this problem was 97%.
Suppose we create a DataFrame called socal containing
only King Triton’s flights departing from SAN, LAX, or SNA (John Wayne
Airport in Orange County). socal has 10 rows; the bar chart
below shows how many of these 10 flights departed from each airport.
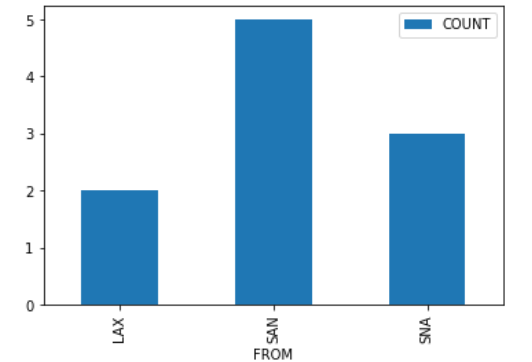
Consider the DataFrame that results from merging socal
with itself, as follows:
double_merge = socal.merge(socal, left_on='FROM', right_on='FROM')How many rows does double_merge have?
Answer: 38
There are two flights from LAX. When we merge socal with
itself on the 'FROM' column, each of these flights gets
paired up with each of these flights, for a total of four rows in the
output. That is, the first flight from LAX gets paired with both the
first and second flights from LAX. Similarly, the second flight from LAX
gets paired with both the first and second flights from LAX.
Following this logic, each of the five flights from SAN gets paired with each of the five flights from SAN, for an additional 25 rows in the output. For SNA, there will be 9 rows in the output. The total is therefore 2^2 + 5^2 + 3^2 = 4 + 25 + 9 = 38 rows.
The average score on this problem was 27%.
We define a “route” to be a departure and arrival airport pair. For
example, all flights from 'SFO' to 'SAN' make
up the “SFO to SAN route”. This is different from the “SAN to SFO
route”.
Fill in the blanks below so that
most_frequent.get('FROM').iloc[0] and
most_frequent.get('TO').iloc[0] correspond to the departure
and destination airports of the route that King Triton has spent the
most time flying on.
most_frequent = flights.groupby(__(a)__).__(b)__
most_frequent = most_frequent.reset_index().sort_values(__(c)__)What goes in blank (a)?
Answer: ['FROM', 'TO']
We want to organize flights by route. This means we need to group by
both 'FROM' and 'TO' so any flights with the
same pair of departure and arrival airports get grouped together. To
group by multiple columns, we must use a list containing all these
column names, as in flights.groupby(['FROM', 'TO']).
The average score on this problem was 72%.
What goes in blank (b)?
count()
mean()
sum()
max()
Answer: sum()
Every .groupby command needs an aggregation function!
Since we are asked to find the route that King Triton has spent the most
time flying on, we want to total the times for all flights on a given
route.
Note that .count() would tell us how many flights King
Triton has taken on each route. That’s meaningful information, but not
what we need to address the question of which route he spent the most
time flying on.
The average score on this problem was 58%.
What goes in blank (c)?
by='HOURS', ascending=True
by='HOURS', ascending=False
by='HOURS', descending=True
by='DIST', ascending=False
Answer:
by='HOURS', ascending=False
We want to know the route that King Triton spent the most time flying
on. After we group flights by route, summing flights on the same route,
the 'HOURS' column contains the total amount of time spent
on each route. We need most_frequent.get('FROM').iloc[0]
and most_frequent.get('TO').iloc[0] to correspond with the
departure and destination airports of the route that King Triton has
spent the most time flying on. To do this, we need to sort in descending
order of time, to bring the largest time to the top of the DataFrame. So
we must sort by 'HOURS' with
ascending=False.
The average score on this problem was 94%.
The seat-back TV on one of King Triton’s more recent flights was very
dirty and was full of fingerprints. The fingerprints made an interesting
pattern. We’ve stored the x and y positions of each fingerprint in the
DataFrame fingerprints, and created the following
scatterplot using
fingerprints.plot(kind='scatter', x='x', y='y')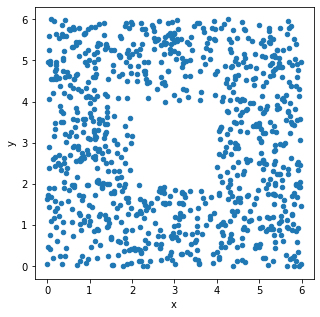
True or False: The histograms that result from the following two lines of code will look very similar.
fingerprints.plot(kind='hist',
                  y='x',
                  density=True,
                  bins=np.arange(0, 8, 2))
and
fingerprints.plot(kind='hist',
                  y='y',
                  density=True,
                  bins=np.arange(0, 8, 2))
True
False
Answer: True
The only difference between the two code snippets is the data values
used. The first creates a histogram of the x-values in
fingerprints, and the second creates a histogram of the
y-values in fingerprints.
Both histograms use the same bins:
bins=np.arange(0, 8, 2). This means the bin endpoints are
[0, 2, 4, 6], so there are three distinct bins: [0, 2), [2,
4), and [4, 6]. Remember the
right-most bin of a histogram includes both endpoints, whereas others
include the left endpoint only.
Let’s look at the x-values first. If we divide the
scatterplot into nine equally-sized regions, as shown below, note that
eight of the nine regions have a very similar number of data points.
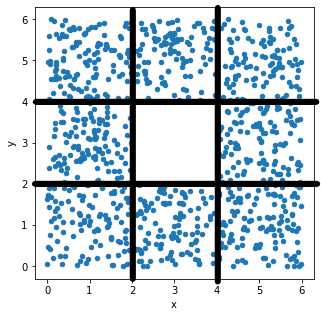
Aside from the middle region, about \frac{1}{8} of the data falls in each region.
That means \frac{3}{8} of the data has
an x-value in the first bin [0,
2), \frac{2}{8} of the data has
an x-value in the middle bin [2,
4), and \frac{3}{8} of the data
has an x-value in the rightmost bin [4, 6]. This distribution of
x-values into bins determines what the histogram will look
like.
Now, if we look at the y-values, we’ll find that \frac{3}{8} of the data has a
y-value in the first bin [0,
2), \frac{2}{8} of the data has
a y-value in the middle bin [2,
4), and \frac{3}{8} of the data
has a y-value in the last bin [4,
6]. That’s the same distribution of data into bins as the
x-values had, so the histogram of y-values
will look just like the histogram of x-values.
Alternatively, an easy way to see this is to use the fact that the
scatterplot is symmetric over the line y=x, the line that makes a 45 degree angle
with the origin. In other words, interchanging the x and
y values doesn’t change the scatterplot noticeably, so the
x and y values have very similar
distributions, and their histograms will be very similar as a
result.
The average score on this problem was 88%.
Below, we’ve drawn a histogram using the line of code
fingerprints.plot(kind='hist',
                  y='x',
                  density=True,
                  bins=np.arange(0, 8, 2))
However, our Jupyter Notebook was corrupted, and so the resulting histogram doesn’t quite look right. While the height of the first bar is correct, the histogram doesn’t contain the second or third bars, and the y-axis is replaced with letters.
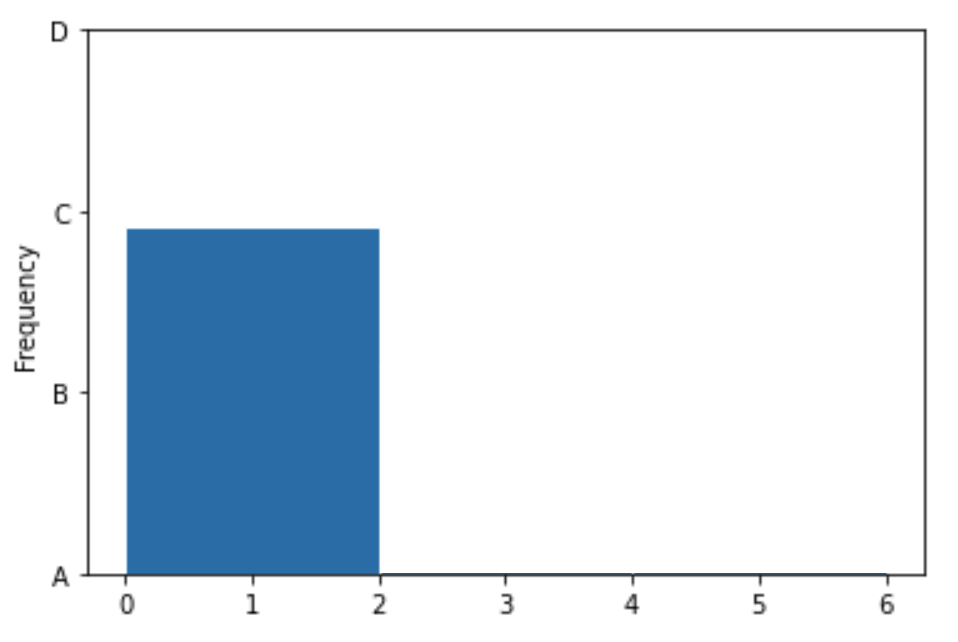
Which of the four options on the y-axis is closest to where the height of the middle bar should be?
A
B
C
D
Which of the four options on the y-axis is closest to where the height of the rightmost bar should be?
A
B
C
D
Answer: B, then C
We’ve already determined that the first bin should contain \frac{3}{8} of the values, the middle bin should contain \frac{2}{8} of the values, and the rightmost bin should contain \frac{3}{8} of the values. The middle bar of the histogram should therefore be two-thirds as tall as the first bin, and the rightmost bin should be equally as tall as the first bin. The only reasonable height for the middle bin is B, as it’s closest to two-thirds of the height of the first bar. Similarly, the rightmost bar must be at height C, as it’s the only one close to the height of the first bar.
The average score on this problem was 94%.
It turns out that King Triton is so busy that he doesn’t even book his own flights – he has a travel agent who books his flights for him. He doesn’t get to choose the airline that he flies on, but his travel agent gave him the following table, which describes the probability of each of his flights in 2022 being on Delta, United, American, or another airline:
| Airline | Chance |
|---|---|
| Delta | 0.4 |
| United | 0.3 |
| American | 0.2 |
| All other airlines | 0.1 |
The airline for one flight has no impact on the airline for another flight.
For this question, suppose that King Triton schedules 3 flights for January 2022.
What is the probability that all 3 flights are on United? Give your answer as an exact decimal between 0 and 1 (not a Python expression).
Answer: 0.027
For all three flights to be on United, we need the first flight to be on United, and the second, and the third. Since these are independent events that do not impact one another, and we need all three flights to separately be on United, we need to multiply these probabilities, giving an answer of 0.3*0.3*0.3 = 0.027.
Note that on an exam without calculator access, you could leave your answer as (0.3)^3.
The average score on this problem was 93%.
What is the probability that all 3 flights are on Delta, or all on United, or all on American? Give your answer as an exact decimal between 0 and 1 (not a Python expression).
Answer: 0.099
We already calculated the probability of all three flights being on United as (0.3)^3 = 0.027. Similarly, the probability of all three flights being on Delta is (0.4)^3 = 0.064, and the probability of all three flights being on American is (0.2)^3 = 0.008. Since we cannot satisfy more than one of these conditions at the same time, we can separately add their probabilities to find a total probability of 0.027 + 0.064 + 0.008 = 0.099.
The average score on this problem was 76%.
True or False: The probability that all 3 flights are on the same airline is equal to the probability you computed in the previous subpart.
True
False
Answer: False
It’s not quite the same because the previous subpart doesn’t include the probability that all three flights are on the same airline which is not one of Delta, United, or American. For example, there is a small probability that all three flights are on Allegiant or all three flights are on Southwest.
The average score on this problem was 90%.
King Triton has boarded a Southwest flight. For in-flight refreshments, Southwest serves four types of cookies – chocolate chip, gingerbread, oatmeal, and peanut butter.
The flight attendant comes to King Triton with a box containing 10 cookies:
The flight attendant tells King Triton to grab 2 cookies out of the box without looking.
Fill in the blanks below to implement a simulation that estimates the probability that both of King Triton’s selected cookies are the same.
# 'cho' stands for chocolate chip, 'gin' stands for gingerbread,
# 'oat' stands for oatmeal, and 'pea' stands for peanut butter.

cookie_box = np.array(['cho', 'cho', 'cho', 'cho', 'gin',
                       'gin', 'gin', 'oat', 'oat', 'pea'])

repetitions = 10000
prob_both_same = 0
for i in np.arange(repetitions):
    grab = np.random.choice(__(a)__)
    if __(b)__:
        prob_both_same = prob_both_same + 1
prob_both_same = __(c)__What goes in blank (a)?
cookie_box, repetitions, replace=False
cookie_box, 2, replace=True
cookie_box, 2, replace=False
cookie_box, 2
Answer:
cookie_box, 2, replace=False
We are told that King Triton grabs two cookies out of the box without
looking. Since this is a random choice, we use the function
np.random.choice to simulate this. The first input to this
function is a sequence of values to choose from. We already have an
array of values to choose from in the variable cookie_box.
Calling np.random.choice(cookie_box) would select one
cookie from the cookie box, but we want to select two, so we use an
optional second parameter to specify the number of items to randomly
select. Finally, we should consider whether we want to select with or
without replacement. Since cookie_box contains individual
cookies and King Triton is selecting two of them, he cannot choose the
same exact cookie twice. This means we should sample without
replacement, by specifying replace=False. Note that
omitting the replace parameter would use the default option
of sampling with replacement.
The average score on this problem was 92%.
What goes in blank (b)?
Answer: grab[0] == grab[1]
The idea of a simulation is to do some random process many times. We
can use the results to approximate a probability by counting up the
number of times some event occurred, and dividing that by the number of
times we did the random process. Here, the random process is selecting
two cookies from the cookie box, and we are doing this 10,000 times. The
approximate probability will be the number of times in which both
cookies are the same divided by 10,000. So we need to count up the
number of times that both randomly selected cookies are the same. We do
this by having an accumulator variable that starts out at 0 and gets
incremented, or increased by 1, every time both cookies are the same.
The code has such a variable, called prob_both_same, that
is initialized to 0 and gets incremented when some condition is met.
We need to fill in the condition, which is that both randomly
selected cookies are the same. We’ve already randomly selected the
cookies and stored the results in grab, which is an array
of length 2 that comes from the output of a call to
np.random.choice. To check if both elements of the
grab array are the same, we access the individual elements
using brackets with the position number, and compare using the
== symbol to check equality. Note that at the end of the
for loop, the variable prob_both_same will
contain a count of the number of trials out of 10,000 in which both of
King Triton’s cookies were the same flavor.
The average score on this problem was 79%.
What goes in blank (c)?
prob_both_same / repetitions
prob_both_same / 2
np.mean(prob_both_same)
prob_both_same.mean()
Answer:
prob_both_same / repetitions
After the for loop, prob_both_same contains
the number of trials out of 10,000 in which both of King Triton’s
cookies were the same flavor. We’d like it to represent the approximate
probability of both cookies being the same flavor, so we need to divide
the current value by the total number of trials, 10,000. Since this
value is stored in the variable repetitions, we can divide
prob_both_same by repetitions.
The average score on this problem was 93%.
Note: This problem is out of scope; it covers material no longer included in the course.
In response to the pandemic, some airlines chose to leave middle seats empty, while others continued seating passengers in middle seats. Let’s suppose Delta did not seat passengers in middle seats during the pandemic, and United did seat passengers in middle seats during the pandemic.
Delta wants to know whether customers were satisfied with them for making this decision not to use middle seats. Suppose they have access to a dataset of customer satisfaction surveys, taken annually for each airline. How can Delta determine whether its new seating policy caused an increase in customer satisfaction?
Compare Delta’s average customer satisfaction before and after this change went into effect.
Compare Delta’s average customer satisfaction after the change went into effect to United’s average customer satisfaction at the same point in time.
Compare the change in Delta’s average customer satisfaction to the change in United’s average customer satisfaction, throughout the same period of time, spanning the change.
None of the above.
Answer: None of the above.
None of the options isolate the effect of the seating policy because they do not use randomized controlled trials. Even measuring the change in each airline’s average satisfaction rating as described in the third option is insufficient because we don’t know whether any differences are due to the changed seating policy or other changes. It’s possible that many things changed around the time of the pandemic, and we have no way of separating the effects of each of these changes. For example, maybe United stopped serving snacks during the pandemic and Delta continued serving snacks, at around the same time as the seating changes went into effect. If we find a difference in average customer satisfaction between the airlines, we have no way of knowing whether it’s because of the differences in seating policies or snack policies (or something else).
The average score on this problem was 13%.