← return to practice.dsc10.com
Instructor(s): Rod Albuyeh, Suraj Rampure, Janine Tiefenbruck
This exam was administered in-person. The exam was closed-notes, except students were provided a copy of the DSC 10 Reference Sheet. No calculators were allowed. Students had 50 minutes to take this exam.
Note (groupby / pandas 2.0): Pandas 2.0+ no longer
silently drops columns that can’t be aggregated after a
groupby, so code written for older pandas may behave
differently or raise errors. In these practice materials we use
.get() to select the column(s) we want after
.groupby(...).mean() (or other aggregations) so that our
solutions run on current pandas. On real exams you will not be penalized
for omitting .get() when the old behavior would have
produced the same answer.
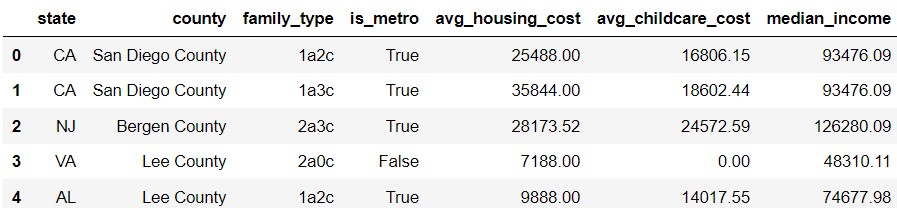
An area’s cost of living describes how expensive it is to live in
that area. In this exam, we’ll work with the DataFrame
living_cost, which describes the typical cost of living for
different types of families across all 3143 counties in the 50 United
States. The first few rows of living_cost are shown below,
but living_cost has many more rows than
shown.
Two counties in the same state will never have the same name, but as the last two rows above illustrate, there are some counties in different states with the same name, like Lee County.
The "family_type" column uses a code to describe the
number of adults and children in a family. For example, a value of
"2a1c" represents families with two adults and one child.
There are ten unique values, as follows: "1a0c",
"1a1c", "1a2c", "1a3c",
"1a4c", "2a0c", "2a1c",
"2a2c", "2a3c", "2a4c". We will
assume that all families fall into one of these ten
categories, and all ten family structures are present
in each US county.
Each of the 31430 rows of the DataFrame represents a unique
combination of "state", "county", and
"family_type". As a result, there will be more than one row
with a "state" of "CA" and a
"county" of "San Diego", corresponding to
different values of "family_type". Similarly, there will be
many rows such that "family_type" is "2a1c",
all corresponding to different counties. There is only one
row, however, where "state" is "CA",
"county" is "San Diego", and
"family_type" is "1a2c"
In addition to the "state", "county", and
"family_type" columns, living_cost includes
the following columns.
"is_metro" (bool): True if
the county is part of a metropolitan (urban) area, False
otherwise. This value is the same for all rows of the DataFrame
corresponding to the same county and state."avg_housing_cost" (int): The average
yearly cost of housing, in dollars, for families of the given size in
the given county and state."avg_childcare_cost" (int): The average
yearly cost of childcare, in dollars, for families of the given size in
the given county and state."median_income" (int): The median annual
income, in dollars, for families of the given size in the given county
and state.Throughout the exam, assume we have already run
import babypandas as bpd and
import numpy as np.
You’re interested in comparing the "avg_housing_cost"
across different "family_type" groups for San Diego County,
CA specifically. Which type of visualization would be most
appropriate?
Scatter plot
Line plot
Bar chart
Histogram
Answer: Bar chart
"family_type" is a categorical variable, and we use bar
charts to visualize the distribution of categorical variables.
"avg_housing_cost")."family_type".
The average score on this problem was 89%.
Suppose we run the three lines of code below.
families = living_cost.groupby("family_type").median()
sorted_families = families.sort_values(by="avg_housing_cost")
result = sorted_families.get("avg_childcare_cost").iloc[0]
Which of the following does result evaluate to?
The median "avg_childcare_cost" of the
"family_type" with the lowest median
"avg_housing_cost".
The median "avg_childcare_cost" of the
"family_type" with the highest median
"avg_housing_cost".
The median "avg_housing_cost" of the
"family_type" with the lowest median
"avg_childcare_cost".
The median "avg_housing_cost" of the
"family_type" with the highest median
"avg_childcare_cost".
Answer: The median "avg_childcare_cost"
of the "family_type" with the lowest median
"avg_housing_cost".
When we grouped living_cost by
"family_type", families is a DataFrame with
one row per "family_type". Using the .median()
aggregation method takes the median of all numerical columns per
"family_type".
sorted_families is the families DataFrame,
but sorted in ascending order based on the
"avg_housing_cost" column. The first row of
sorted_families is the "family_type" with the
lowest median "avg_housing_cost", and the last row of
sorted_families is the "family_type" with the
highest median "avg_housing_cost".
In the last line of code, we’re getting the
"avg_childcare_cost" column from the
sorted_families DataFrame. We then use iloc to
get the first entry in the "avg_childcare_cost" column.
Since sorted_families is sorted in ascending order, this
means that we’re getting the lowest median in the column. Therefore,
result evaluates to the median
"avg_childcare_cost" of the "family_type" with
the lowest median "avg_housing_cost".
The average score on this problem was 82%.
Suppose we define another_result as follows.
another_result = (living_cost.groupby("state").count()
                  .sort_values(by="median_income", ascending=False)
                  .get("median_income").index[0])
What does another_result represent?
The state with the highest median income.
The median income in the state with the highest median income.
The state with the most counties.
The median income in the state with the most counties.
Answer: The state with the most counties.
The living_cost DataFrame is being grouped by the
"state" column, so there is now one row per
"state". By using the .count() aggregation
method, the columns in the DataFrame will contain the number of rows
in living_count for each "state". All of the
columns will also be the same after using .count(), so they
will all contain the distribution of "state". Since
living_cost has data on every county in the US, the grouped
DataFrame represents the number of counties that each state has.
We then sort the DataFrame in descending order, so the state with the
most counties is at the top of the DataFrame. The last line of the
expression gets a column and uses .index to get the state
corresponding to the first entry, which happens to be the state with the
most counties and the value that gets assigned to
another_result.
Since all the columns are the same, it doesn’t matter which column we
pick to use in the .sort_values() method. In this case, we
used the "median_income" column, but picking any other
column will produce the same result.
The average score on this problem was 65%.
Which of the following DataFrames has exactly four columns?
living_cost.groupby("family_type").min()
living_cost.groupby("family_type").sum()
living_cost.groupby("family_type").count()
None of the above.
Answer:
living_cost.groupby("family_type").sum()
Since we can’t take the sum of columns with categorical data, all of
the columns in living_cost that contain non-numerical data
are dropped after we use the .sum() aggregation method.
There are four columns in living_cost that have numerical
data ("is_metro", "avg_housing_cost",
"avg_childcare_cost", and "median_income").
Since Python can take the sum of these numerical columns, these four
columns are kept. Therefore, the resulting DataFrame has exactly four
columns.
Although "is_metro" contains Boolean values, Python can
still calculate the sum of this column. The Boolean value
True corresponds to 1 and False corresponds to
0.
The average score on this problem was 35%.
Suppose we define the Series three_columns to be the
concatenation of three columns of the living_cost DataFrame
as follows.
three_columns = (living_cost.get("state") + " " +
                 living_cost.get("county") + " " +
                 living_cost.get("family_type"))
For example, the first element of three_columns is the
string "CA San Diego County 1a2c" (refer back to the first
row of living_cost provided in the data overview).
What does the following expression evaluate to?
(living_cost.assign(geo_family=three_columns)
            .groupby("geo_family").count()
.shape[0]) 10, the number of distinct
"family_type" values.
50, the number of states in the US.
500, the number of combinations of
states in the US and "family_type" values.
3143, the number of counties in the US.
31430, the number of rows in the
living_cost DataFrame.
Answer: 31430, the
number of rows in the living_cost DataFrame.
The first line of the expression creates a new column in
living_cost, called "geo_family" that
represents the concatenation of the values in
"three_columns". When we group the DataFrame by
"geo_family", we create a new DataFrame that contains a row
for every unique value in "three_columns".
"three_columns" has various combinations of
"state", "country", and
"family_type". Since it’s given in the DataFrame
description that each of the 31430 rows of the DataFrame represents a
different combination of "state", "country",
and "family_type", this means that the grouped DataFrame
has 31430 unique combinations as well. Therefore, when we use
.shape[0] to get the number of rows in the grouped
DataFrame in the last line of the expression, we get the same value as
the number of rows in the living_cost DataFrame, 31430.
The average score on this problem was 74%.
Suppose we define the three variables below.
J = living_cost.get("county") == "Benton County"
K = living_cost.get("state") == "IN"
L = living_cost.get("family_type") == "1a2c"
Feel free to use these variables in your solutions to the following questions.
Fill in the blanks so that the expression below evaluates to the average yearly childcare cost for families with one adult and two children in Benton County, IN.
__(a)__.__(b)__.iloc[0]What goes in blank (a)?
What goes in blank (b)?
Answer:
living_cost[J & K & L]The first step is to query the rows in the DataFrame that meet our
specific criteria. In this case, we want the rows in the DataFrame where
the county is "Benton County", the state is
"IN", and the family has 1 adult and 2 children.
J, K, and L specify these
criteria. When used to query the living_cost DataFrame, we
are able to obtain a DataFrame with only one row, corresponding this
family type in this specific county.
The average score on this problem was 69%.
Answer:
get("avg_childcare_cost")Once we have a DataFrame that contains the row we need, we need to
use it to get the average yearly childcare cost. To do that, we get out
the "avg_childcare_cost" column and access the entry in row
0 with .iloc[0]. This works because after querying, there
is only one row, and it corresponds exactly to the families with one
adult and two children in Benton County, IN.
The average score on this problem was 57%.
Fill in the blanks so that the expression below evaluates to the number of states with a county named Benton County.
__(c)__.__(d)__ / 10What goes in blank (c)?
What goes in blank (d)?
Answer:
living_cost[J]Since we want to find how many states have a county named
"Benton County", we first want to obtain all the rows of
the DataFrame where the county is "Benton County". Variable
J specifies this condition, so we use it to query and
obtain a DataFrame with the rows in living_cost where the
county is "Benton County."
The average score on this problem was 60%.
Answer:
shape[0]Now that we have all the rows in the DataFrame where the county is
"Benton County", let’s consider how many rows it has. Each
row of this DataFrame represents a unique combination of
"state" and "family_type" for counties called
"Benton County". We know from the data description that
each of the ten family structures is present in each county. This means
that for each state with a county called "Benton County",
our DataFrame has exactly ten rows. Therefore, the number of states with
a county called "Benton County" is the total number of rows
in our DataFrame divided by ten. Therefore, we should fill in blank (d)
with .shape[0] to extract the number of rows from our
DataFrame.
The average score on this problem was 40%.
Suppose we want to assign a new column named
"family_size" to living_cost that contains the
total number of people in each family, stored as an int. We do so as
follows.
living_cost = living_cost.assign(
              family_size=living_cost.get("family_type").apply(num_people))
Which of the following options correctly define the function
num_people such that the line above adds the
"family_size" column as desired? Select all that
apply.
Hint: You can access an individual character in a string
using the position number in square brackets. For example,
"midterm"[0] evaluates to "m" and
"midterm"[1] evaluates to "i".
# Option 1
def num_people(fam):
    return int(fam[0]) + int(fam[2])
------------------------------------
# Option 2
def num_people(fam):
    return int(fam[0] + fam[2])
------------------------------------
# Option 3
def num_people(fam):
    x = int(fam[0] + fam[2])
    return int(x / 10) + x % 10
------------------------------------
# Option 4
def num_people(fam):
    x = fam.strip("c").split("a")
    return int(x[0]) + int(x[1])
------------------------------------
# Option 5
def num_people(fam):
    x = 0
    for i in fam:
        if i % 2 == 0:
            x = x + 1
    return x
------------------------------------
# Option 6
def num_people(fam):
    x = 0
    for i in np.arange(len(fam)):
        if i % 2 == 0:
            x = x + int(fam[i])
    return x
Option 1
Option 2
Option 3
Option 4
Option 5
Option 6
None of the above.
Answer: Options 1, 3, 4, 6
Option 1: In order to get the number of people within a family, we can look at the character at position 0 (for the number of adults) and the character at position 2 (for the number of children). Converting each character into an int and adding these ints yields the correct results.
Option 2: This is similar to Option 1, however, the key difference is
that the separate strings are concatenated first, then converted into an
integer afterwards. Remember that the plus sign between two strings
concatenates the strings together, and does not add mathematically. For
example, on a family type of "1a2c", "1" and
"2" will be extracted and concatenated together as
"12", then converted to the int 12. This is returned
instead of the value 3 that we are looking for.
Option 3: This option is similar to Option 2, however, it includes an
extra step after concatenation. int(x/10) gets the value in
the tens place, taking advantage of the fact that the int()
function always rounds down. At the same time, x % 10 gets
the value in the ones place by calculating the remainder upon division
by ten. Looking at the example of "1a2c", the first line
will set x = 12 and then int(12/10) will yield
1 while 12 % 10 yields 2. Adding these together achieves
the correct answer of 3.
Option 4: This option is similar to Option 1, but includes the
initial step of removing "c" from the string and separating
by "a". After this, x is a list of two
elements, the first of which represents the number of adults in the
family, and the second of which represents the number of children in the
family. These are separately converted to ints then added up in the last
line.
Option 5: This option iterates through the input string, where
i represents each individual character in the string. For
example, on an input of "1a2c", i is first set
to 1, then a, then 2, then
c. However, calculating the remainder when we divide by two
(i % 2) only makes sense when i is a number,
and results in an error when i is a string.
Option 6: This is a similar approach to Option 5, except this time,
i represents each of the numbers 0, 1, 2, and 3, since
len(fam) is always 4. For each such i, which
we can think of as the position number, the code will check if the
position number is even (i % 2 == 0). This is only true for
position 0 and 2, which are the positions that contain the numbers of
adults and children in the family. When this condition is met, we add
the value at that position onto our running total, x, which
at the end, equals the total number of adults and children in the
family.
The average score on this problem was 73%.
For those who plan on having children, an important consideration
when deciding whether to live in an area is the cost of raising children
in that area. The DataFrame expensive, defined below,
contains all of the rows in living_cost where the
"avg_childcare_cost" is at least $20,000.
expensive = living_cost[living_cost.get("avg_childcare_cost")
                        >= 20000]
We’ll call a county an “expensive county" if there is at
least one "family_type" in that county with an
"avg_childcare_cost" of at least $20,000. Note that all
expensive counties appear in the expensive DataFrame, but
some may appear multiple times (if they have multiple
"family_type"s with an "avg_childcare_cost" of
at least $20,000).
Recall that the "is_metro" column contains Boolean
values indicating whether or not each county is part of a metropolitan
(urban) area. For all rows of living_cost (and, hence,
expensive) corresponding to the same geographic location,
the value of "is_metro" is the same. For instance, every
row corresponding to San Diego County has an "is_metro"
value of True.
Fill in the blanks below so that the result is a DataFrame indexed by
"state" where the "is_metro" column gives the
proportion of expensive counties in each state that are part of
a metropolitan area. For example, if New Jersey has five
expensive counties and four of them are metropolitan, the row
corresponding to a New Jersey should have a value of 0.8 in the
"is_metro" column.
(expensive.groupby(____(a)____).max()
          .reset_index()
.groupby(____(b)____).____(c)____)What goes in blank (a)?
Answer: ["state", "county"] or
["county", "state"]
We are told that all expensive counties appear in the
expensive DataFrame, but some may appear multiple times,
for several different "family_type" values. The question we
want to answer, however, is about the proportion of expensive counties
in each state that are part of a metropolitan area, which has nothing to
do with "family_type". In other words, we don’t want or
need multiple rows corresponding to the same US county.
To keep just one row for each US county, we can group by both
"state" and "county" (in either order). Then
the resulting DataFrame will have one row for each unique combination of
"state" and "county", or one row for each US
county. Notice that the .max() aggregation method keeps the
last alphabetical value from the "is_metro" column in each
US county. If there are multiple rows in expensive
corresponding to the same US county, we are told that they will all have
the same value in the "is_metro" column, so taking the
maximum just takes any one of these values, which are all the same. We
could have just as easily taken the minimum.
Notice the presence of .reset_index() in the provided
code. That is a clue that we may need to group by multiple columns in
this problem!
The average score on this problem was 14%.
What goes in blank (b)?
Answer: "state"
Now that we have one row for each US county that is considered
expensive, we want to proceed by calculating the proportion of expensive
counties within each state that are in a metropolitan area. Our goal is
to organize the counties by state and create a DataFrame indexed only by
"state" so we want to group by "state" to
achieve this.
The average score on this problem was 68%.
What goes in blank (c)?
Answer: mean()
Recall that the "is_metro" column consists of Boolean
values, where True equals 1 and False equals
0. Notice that if we take the average of the "is_metro"
column for all the counties in a given state, we’ll be computing the sum
of these 0s and 1s (or the number of True values) divided
by the total number of expensive counties in that state. This gives the
proportion of expensive counties in the state that are in a metropolitan
area. Thus, when we group the expensive counties according to what state
they are in, we can use the .mean() aggregation method to
calculate the proportion of expensive counties in each state that are in
a metropolitan area.
The average score on this problem was 35%.
The rows in living_cost with a
"family_type" value of "1a0c" correspond to
families that consist of individuals living on their own. We’ll call
such families “solo families." Below, we’ve visualized the distribution
of the "median_income" column, but only for rows
corresponding to solo families. Instead of visualizing median incomes in
dollars, we’ve visualized them in thousands of dollars.
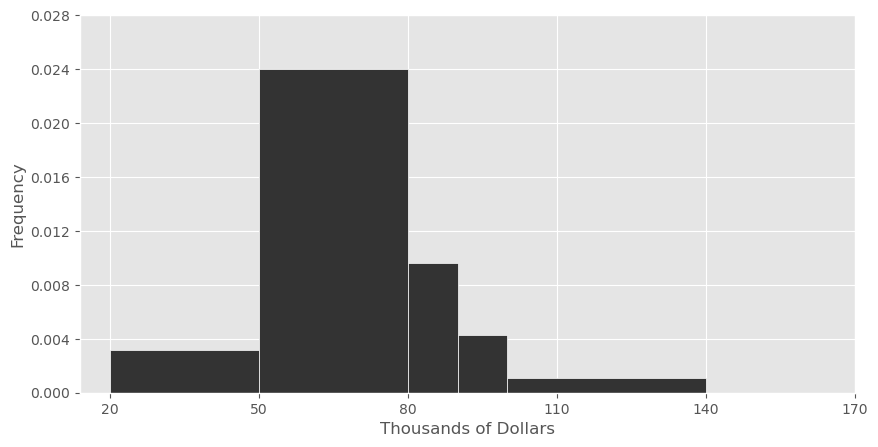
Suppose we’re interested in splitting the [50, 80) bin into two separate bins — a [50, 70) bin and a [70, 80) bin.
Let h_1 be the height of the new bar corresponding to the [50, 70) bin and let h_2 be the height of the new bar corresponding to the [70, 80) bin.
What are the minimum and maximum possible values of h_2? Give your answers as decimals rounded to three decimal places.
Answer: Minimum: 0
In a histogram, we do not know how data are distributed within a bin. This means that when we split the bin with range [50, 80) into two smaller bins, we have no way of knowing how the data from the original bin will be distributed. It is possible that all of the data in the [50, 80) bin fell between 50 and 70. In this case, there would be no data in the [70, 80) bin, and as such, the height of this new bar would be 0.
The average score on this problem was 61%.
Answer: Maximum: 0.072
Similarly, if all of the data in the original [50,80) bin fell between 70 and $80, then all of the data that was originally in the [50, 80) bin would be allocated to the [70, 80) bin. In a density histogram, the area of a bar corresponds to the proportion of the data contained within the bar (for example, a bar with area 0.5 contains 50% of the total data). Since the maximum value of h_2 is achieved when the bin [70, 80) contains all of the data originally contained in the bin [50, 80), this means area of the [70, 80) bar must be the same as the original area of the [50, 80) bar, since it contains the same proportion of data.
The original bar had area 30 * 0.024 = 0.72, which comes from multiplying its base and its height. Since the new bar has a base of 10, its height must be 0.072 to make its area equal to 0.72. Intuitively, if a rectangle is one third as wide as another rectangle and has the same area, it must be three times as tall.
The average score on this problem was 42%.
Suppose that the number of counties in which the median income of solo families is in the interval [50, 70) is r times the number of counties in which the median income of solo families is in the interval [70, 80). Given this fact, what is the value of \frac{h_1}{h_2}, the ratio of the heights of the two new bars?
\frac{1}{r}
\frac{2}{r}
\frac{3}{r}
\frac{r}{2}
\frac{r}{3}
2r
3r
Answer: \frac{r}{2}
The key to solving this problem is recognizing that the number of counties in a given interval is directly related to the area of that interval’s bar in the histogram. This comes from the property of density histograms that the area of a bar corresponds to the proportion of the data contained within the bar.
Given that there are r times the amount of data in the interval [50, 70), in comparison to the interval [70, 80), we know that the area of the bar corresponding to the bin [50, 70) is r times the area of the bar corresponding to the bin [70, 80).
Therefore, if A_1 represents the area of the [50, 70) bar and A_2 represents the area of the [70, 80) bar, we have
A_1 = r \cdot A_2.
Then, since each bar is a rectangle, its area comes from the product of its height and its base. We know the [50, 70) bar has a base of 20 and a height of h_1, and the [70, 80) bar has a base of 10 and a height of h_2. Plugging this in gives
h_1 \cdot 20 = r \cdot h_2 \cdot 10.
From here, we can rearrange terms to get
\frac{h_1}{h_2} = \frac{r}{2}.
The average score on this problem was 40%.
Recall that living_cost has 31430 rows, one for each of the ten possible
"family_type" values in each of the 3143 US counties.
Consider the function state_merge, defined below.
def state_merge(A, B):
    state_A = living_cost[living_cost.get("state") == A]
    state_B = living_cost[living_cost.get("state") == B]
    return state_A.merge(state_B, on="family_type").shape[0]
Suppose Montana ("MT") has 5 counties, and suppose
state_merge("MT", "NV") evaluates to 1050. How
many counties does Nevada ("NV") have? Give your answer as
an integer.
Answer 21
We are told Montana has 5 counties. We don’t know how many counties
Nevada has, but let’s call the number of counties in Nevada x and see how many rows the merged DataFrame
should have, in terms of x. If Montana
has 5 counties, since there are 10 "family_type" values per
county, this means the state_A DataFrame has 50 rows.
Similarly, if Nevada has x counties,
then state_B has 10x rows.
When we merge on "family_type", each of the 5 rows in
state_A with a given "family_type" (say
"2a3c") will match with each of the x rows in state_B with that same
"family_type". This will lead to 5x rows in the output corresponding to each
"family_type", and since there are 10 different values for
"family_type", this means the final output will have 50x rows.
We are told that the merged DataFrame has 1050 rows, so we can find x by solving 50x = 1050, which leads to x = 21.
The average score on this problem was 36%.
King Triton had four children, and each of his four children started their own families. These four families organize a Triton family reunion each year. The compositions of the four families are as follows:
Family W: "1a4c"
Family X: "2a1c"
Family Y: "2a3c"
Family Z: "1a1c"
Suppose we choose one of the fifteen people at the Triton family reunion at random.
Given that the chosen individual is from a family with one child, what is the probability that they are from Family X? Give your answer as a simplified fraction.
Answer: \frac{3}{5}
Given that the chosen individual is from a family with one child, we know that they must be from either Family X or Family Z. There are three individuals in Family X, and there are a total of five individuals from these two families. Thus, the probability of choosing any one of the three individuals from Family X out of the five individuals from both families is \frac{3}{5}.
The average score on this problem was 43%.
Consider the events A and B, defined below.
A: The chosen individual is an adult.
B: The chosen individual is a child.
True or False: Events A and B are independent.
True
False
Answer: False
If two events are independent, knowledge of one event happening does not change the probability of the other event happening. In this case, events A and B are not independent because knowledge of one event gives complete knowledge of the other.
To see this, note that the probability of choosing a child randomly out of the fifteen individuals is \frac{9}{15}. That is, P(B) = \frac{9}{15}.
Suppose now that we know that the chosen individual is an adult. In this case, the probability that the chosen individual is a child is 0, because nobody is both a child and an adult. That is, P(B \text{ given } A) = 0, which is not the same as P(B) = \frac{9}{15}.
This problem illustrates the difference between mutually exclusive events and independent events. In this case A and B are mutually exclusive, because they cannot both happen. But that forces them to be dependent events, because knowing that someone is an adult completely determines the probability that they are a child (it’s zero!)
The average score on this problem was 33%.
Consider the events C and D, defined below.
C: The chosen individual is a child.
D: The chosen individual is from family Y.
True or False: Events C and D are independent.
True
False
Answer: True
If two events are independent, the probability of one event happening does not change when we know that the other event happens. In this case, events C and D are indeed independent.
If we know that the chosen individual is a child, the probability that they come from Family Y is \frac{3}{9}, which simplifies to \frac{1}{3}. That is P(D \text{ given } C) = \frac{1}{3}.
On the other hand, without any prior knowledge, when we select someone randomly from all fifteen individuals, the probability they come from Family Y is \frac{5}{15}, which also simplifies to \frac{1}{3}. This says P(D) = \frac{1}{3}.
In other words, knowledge of C is irrelevant to the probability of D occurring, which means C and D are independent.
The average score on this problem was 35%.
At the reunion, the Tritons play a game that involves placing the four letters into a hat (W, X, Y, and Z, corresponding to the four families). Then, five times, they draw a letter from the hat, write it down on a piece of paper, and place it back into the hat.
Let p = \frac{1}{4} in the questions that follow.
What is the probability that Family W is selected all 5 times?
p^5
1 - p^5
1 - (1 - p)^5
(1 - p)^5
p \cdot (1 - p)^4
p^4 (1 - p)
None of these.
Answer: p^5
The probability of selecting Family W in the first round is p, which is the same for the second round, the third round, and so on. Each of the chosen letters is drawn independently from the others because the result of one draw does not affect the result of the next. We can apply the multiplication rule here and multiply the probabilities of choosing Family W in each round. This comes out to be p\cdot p\cdot p\cdot p\cdot p, which is p^5.
The average score on this problem was 91%.
What is the probability that Family W is selected at least once?
p^5
1 - p^5
1 - (1 - p)^5
(1 - p)^5
p \cdot (1 - p)^4
p^4 (1 - p)
None of these.
Answer: 1 - (1 - p)^5
Since there are too many ways that Family W can be selected to meet the condition that it is selected at least once, it is easier if we calculate the probability that Family W is never selected and subtract that from 1. The probability that Family W is not selected in the first round is 1-p, which is the same for the second round, the third round, and so on. We want this to happen for all five rounds, and since the events are independent, we can multiply their probabilities all together. This comes out to be (1-p)^5, which represents the probability that Family W is never selected. Finally, we subtract (1-p)^5 from 1 to find the probability that Family W is selected at least once, giving the answer 1 - (1-p)^5.
The average score on this problem was 62%.
What is the probability that Family W is selected exactly once, as the last family that is selected?
p^5
1 - p^5
1 - (1 - p)^5
(1 - p)^5
p \cdot (1 - p)^4
p^4 (1 - p)
None of these.
Answer: p \cdot (1 - p)^4
We want to find the probability of Family W being selected only as the last draw, and not in the first four draws. The probability that Family W is not selected in the first draw is (1-p), which is the same for the second, third, and fourth draws. For the fifth draw, the probability of choosing Family W is p. Since the draws are independent, we can multiply these probabilities together, which comes out to be (1-p)^4 \cdot p = p\cdot (1-p)^4.
The average score on this problem was 67%.
After the family reunion, Family Y gets together with nine other
families to play a game. All ten families (which we’ll number 1 through
10) have a composition of "2a3c". Within each family, the
three children are labeled "oldest", "middle",
or "youngest".
In this game, the numbers 1 through 10, representing the ten families, are placed into a hat. Then, five times, they draw a number from the hat, write it down on a piece of paper, and place it back into the hat. If a family’s number is written down on the paper at least twice, then two of the three children in that family are randomly selected to win a prize. The same child cannot be selected to win a prize twice.
Chiachan is the middle child in Family 4. He writes a simulation, which is partially provided on the next page. Fill in the blanks so that after running the simulation,
np.count_nonzero(outcomes == "Outcome Q") / repetitions
gives an estimate of the probability that Chiachan wins a
prize.
np.count_nonzero(outcomes == "Outcome R") / repetitions
gives an estimate of the probability that both of Chiachan’s siblings
win a prize, but Chiachan does not.
np.count_nonzero(outcomes == "Outcome S") / repetitions
gives an estimate of the probability that nobody from Chiachan’s family
wins a prize.
ages = np.array(["oldest", "middle", "youngest"])
outcomes = np.array([])
repetitions = 10000
for i in np.arange(repetitions):
    fams = np.random.choice(np.arange(1, 11), 5, ____(a)____)
    if ____(b)____:
        children = np.random.choice(ages, 2, ____(c)____)
        if not "middle" in children:
            outcomes = np.append(outcomes, ____(d)____)
        else:
            outcomes = np.append(outcomes, ____(e)____)
    else:
outcomes = np.append(outcomes, ____(f)____)What goes in blank (a)?
replace=True
replace=False
Answer: replace=True
A family can be selected more than once, as indicated by “placing the
number back into the hat” in the problem statement. Therefore we use
replace=True to allow for the same family to get picked
more than once.
The average score on this problem was 88%.
What goes in blank (b)?
Answer:
np.count_nonzero(fams == 4) >= 2 or equivalent
Notice that inside the body of the if statement, the
first line defines a variable children which selects two
children from among ages. We are told in the problem
statement that if a family’s number is written down on the paper at
least twice, then two of the three children in that family are randomly
selected to win a prize. Therefore, the condition that we want to check
in the if statement should correspond to Chiachan’s family
number (4) being written down on the paper at least twice.
When we compare the entire fams array to the value 4
using fams == 4, the result is an array of
True or False values, where each
True represents an instance of Chiachan’s family being
chosen. Then np.count_nonzero(fams == 4) evaluates to the
number of Trues, because in Python, True is 1
and False is 0. That is,
np.count_nonzero(fams == 4) represents the number of times
Chichan’s family is selected, and so our condition is
np.count_nonzero(fams == 4) >= 2.
There are many equivalent ways to write this same condition,
including np.count_nonzero(fams == 4) > 1 and
(fams == 4).sum() >= 2.
The average score on this problem was 17%.
What goes in blank (c)?
replace=True
replace=False
Answer: replace=False
A child cannot win a prize twice, so we remove them from the pool after being selected.
The average score on this problem was 86%.
What goes in blank (d)?
"Outcome Q"
"Outcome R"
"Outcome S"
Answer: "Outcome R"
Chiachan is the middle child in the family, and recall that each
outcome corresponds to either Chiachan winning
("Outcome Q"), Chiachan not winning but his siblings
winning ("Outcome R"), or nobody in his family winning
("Outcome S").
This condition checks the negation of the middle child being
selected, which evaluates to True when Chiachan’s siblings
win but he doesn’t, so we append "Outcome R" to the
outcomes array in this case.
The average score on this problem was 76%.
What goes in blank (e)?
"Outcome Q"
"Outcome R"
"Outcome S"
Answer: "Outcome Q"
Chiachan is the middle child in the family, and recall that each
outcome corresponds to either Chiachan winning
("Outcome Q"), Chiachan not winning but his siblings
winning ("Outcome R"), or nobody in his family winning
("Outcome S").
This condition corresponds to the middle child being selected, so we
append "Outcome Q" to the outcomes array in
this case.
The average score on this problem was 75%.
What goes in blank (f)?
"Outcome Q"
"Outcome R"
"Outcome S"
Answer: "Outcome S"
Chiachan is the middle child in the family, and recall that each
outcome corresponds to either Chiachan winning
("Outcome Q"), Chiachan not winning but his siblings
winning ("Outcome R"), or nobody in his family winning
("Outcome S").
This condition is that Chichan’s family was not selected two or more
times, which means nobody in his family will win a prize, so we append
"Outcome S" to the outcomes array in this
case.
The average score on this problem was 80%.