← return to practice.dsc10.com
This quiz was administered in-person. It was closed-book and
closed-note; students were not allowed to use the DSC
10 Reference Sheet. Students had 20 minutes to work on
the quiz.
This quiz covered Lectures 5-10 of the Fall 2024 offering of
DSC 10.
⚠️ PDF version available here .
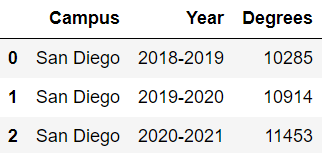
The DataFrame uc has information about the number of
degrees awarded by each University of California campus, for each of the
past six academic years "2018-2019" through
"2023-2024". Since there are ten UC campuses and six years
of data, there are 60 rows. The columns are "Campus" (str),
"Year" (str), and "Degrees" (int).
The first 3 rows of uc are shown here.
Select the correct way to fill in the blank such that the code below
evaluates to a DataFrame with a single row for each UC campus, where the
"Degrees" column contains the average number of degrees
awarded by that campus per academic year (over the past six years).
uc.get(["Campus", "Degrees"]).groupby(______).mean() "Year"
["Campus", "Year"]
"Campus"
["Campus", "Degrees"]
"Degrees"
["Year", "Degrees"]
Answer: "Campus"
groupby("Campus") groups the DataFrame by UC campus.
Calling .mean() then calculates the average number of
degrees awarded across the six academic years for each campus. The
resulting DataFrame has one row per campus.
The average score on this problem was 40%.
Fill in the blank so that the expression below evaluates to the number of years (out of the past six years) in which UC San Diego awarded more than 12,000 degrees.
uc[______].shape[0]Answer:
(uc.get("Campus") == "San Diego") & (uc.get("Degrees") > 12000)
We first filter uc to include only rows where the campus
is "San Diego" and more than 12,000 degrees were awarded.
Then, .shape[0] returns the number of rows in the resulting
DataFrame, corresponding to the number of years in which UC San Diego
awarded more than 12,000 degrees.
The average score on this problem was 61%.
Suppose we plot a density histogram showing the distribution of the
"Degrees" column in uc, using the argument
bins=np.arange(0, uc.get("Degrees").max() + 3000, 2000)
.
Suppose there are 12 rows of uc corresponding to
campuses and years in which fewer than 2000 degrees were awarded. How
tall will the first bar in the histogram be? Give your answer as an
exact decimal or simplified fraction.
Answer: 0.0001
A density histogram has bar heights calculated by dividing the proportion of data points in a bin by the width of that bin.
There are 12 rows with fewer than 2,000 degrees out of 60 total rows. The first bin has a width of 2,000.
Therefore, the height of the first bar is:
\text{Height} = \frac{12/60}{2000} = 0.0001
The average score on this problem was 33%.
Typically, graduation ceremonies happen only at the end of an academic year. For example, students who earn a degree in the 2024-2025 academic year celebrate with a graduation ceremony in 2025.
The function ceremony_year takes as input a string
formatted like those in the "Year" column of
uc, and returns an int corresponding
to the year of the graduation ceremony for that academic year.
For example, ceremony_year("2024-2025") should return
2025. Fill in the return statement of this function
below.
def ceremony_year(academic_year):
returnAnswer:
int(academic_year.split("-")[1])
The .split("-") method splits the academic year string
into two parts using the hyphen as a separator. We use [1]
to access the second part, which represents the graduation ceremony
year. Finally, int() converts this string into an
integer.
For example, ceremony_year("2024-2025") returns
2025.
The average score on this problem was 70%.
What does the following expression evaluate to? Write your answer exactly how the output would appear in Python.
uc.get("Year").apply(ceremony_year).min()Answer: 2019
The .apply(ceremony_year) method applies the
ceremony_year function to every entry in the
"Year" column, converting each academic year into its
corresponding graduation ceremony year.
The .min() method then returns the smallest graduation
ceremony year. Since the earliest academic year in uc is
"2018-2019", the earliest graduation ceremony year is
2019.
The average score on this problem was 87%.
The DataFrame mascots has 10 rows, one for each UC
school, and only two columns, "school" and
"mascot". Assuming that the entries in the
"school" column are formatted exactly how they appear in
the "Campus" column of uc, how many rows does
the following merged DataFrame have?
uc.merge(mascots, left_on="Campus", right_on="school") 10
60
70
600
None of these.
Answer: 60
The uc DataFrame has 60 rows, with six rows for each of
the 10 UC campuses (one for each academic year). The
mascots DataFrame has exactly one row for each campus.
Since the merge matches each row in uc with the
corresponding single row in mascots, no rows are added or
removed. Therefore, the merged DataFrame has 60 rows.
The average score on this problem was 65%.
Define the function puzzle as below.
def puzzle(word):
    if not(len(word) > 2):
        return False
    elif word in "UC San Diego":
        return True
    else:
        return not("UC" in word)
Select all the function calls that evaluate to True.
puzzle("UC San")
puzzle("UC")
puzzle("UCB")
puzzle("HDSI")
Answer:
puzzle("UC San")puzzle("HDSI")Explanation:
Let’s evaluate each function call:
Option 1: puzzle("UC San") returns
True because the string has more than two characters and
"UC San" is contained within
"UC San Diego".
Option 2: puzzle("UC") returns
False because the string has only two characters, so the
first condition is satisfied and the function immediately returns
False.
Option 3: puzzle("UCB") returns
False because the string has more than two characters, but
"UCB" is not contained within "UC San Diego".
The final condition then checks whether "UC" is contained
within "UCB", which is True. The
not operator makes the returned value
False.
Option 4: puzzle("HDSI") returns
True because the string has more than two characters, is
not contained within "UC San Diego", and does not contain
"UC". Therefore, the final condition returns
True.
The average score on this problem was 74%.