← return to practice.dsc10.com
This quiz was administered in-person. Students were allowed 1
double-sided cheatsheet. Students had 20 minutes to
work on the quiz.
This quiz covered Lectures 13-15 of the Fall 2025 offering of
DSC 10.
Note (groupby / pandas 2.0): Pandas 2.0+ no longer
silently drops columns that can’t be aggregated after a
groupby, so code written for older pandas may behave
differently or raise errors. In these practice materials we use
.get() to select the column(s) we want after
.groupby(...).mean() (or other aggregations) so that our
solutions run on current pandas. On real exams you will not be penalized
for omitting .get() when the old behavior would have
produced the same answer.
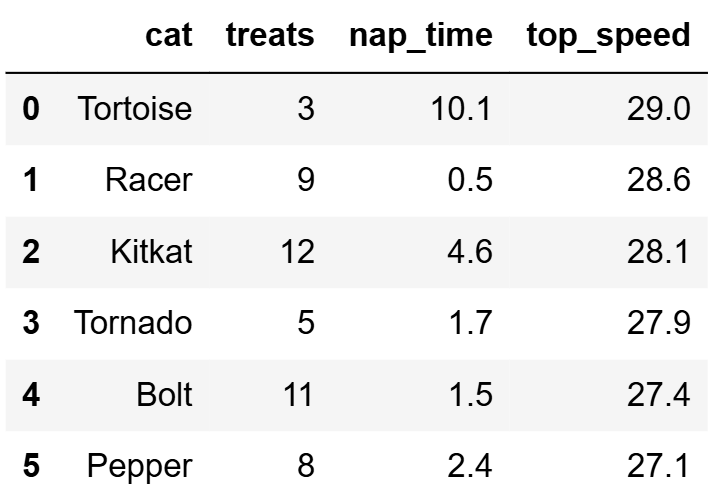
Suppose that at the cat adoption center, all cats stay for just one
day before being adopted. The cats DataFrame contains a
simple random sample of 500 cats from the adoption
center. In addition to each cat’s "name" (str), we have the
following information about their single day at the adoption center:
number of "treats" consumed (int), "nap_time"
in hours (float), and "top_speed" (float) in miles per
hour. cats is sorted in descending order
of "top_speed" with the first few rows shown.
A sleepy cat is a cat that naps for at least 5 hours. You want to
estimate the proportion of all sleepy cats that
consumed at least 10 treats, based on the data in cats.
Fill in the blanks below to generate an array of 10000 bootstrapped estimates for this proportion.
estimates = np.array([])
subset = cats[__(a)__]
for i in np.arange(10000):
    resample = __(b)__
    proportion = __(c)__ / __(d)__
estimates = np.append(estimates, proportion)(a): cats.get("nap time") >= 5
(b):
subset.sample(subset.shape[0], replace=True)
(c):
resample[resample.get("treats") >= 10].shape[0]
(d): resample.shape[0]
The average score on this problem was 65%.
Fill in the blanks below so that treats_interval
evaluates to a 90% confidence interval for the true proportion of all
sleepy cats that consumed at least 10 treats.
ci_low = np.percentile(estimates, __(a)__)
ci_high = np.percentile(estimates, __(b)__)
treats_interval = [ci_low, ci_high](a): 5
(b): 95
The average score on this problem was 93%.
Suppose treats_interval evaluates to
[0.10, 0.15]. Select all true statements.
Between 10\% and 15\% of all sleepy cats also consumed at least 10 treats.
If we increase our confidence level to 95\%, then the width of our interval will decrease and our interval will become more precise.
There is a 90% chance that the true proportion of all sleepy cats that consumed at least 10 treats is between 10\% and 15\%.
None of the above.
Answer: None of the above.
The average score on this problem was 85%.
Your friend’s cat, Bugatti, is not represented in cats.
If Bugatti’s top speed is 27.2 miles per hour, what percentile is
Bugatti’s top speed in, relative to all the cats in the
cats DataFrame?
1st
5th
6th
83rd
95th
99th
Answer: 99th
The average score on this problem was 67%.
The distribution of the "treats" column is shown below,
with the median labeled.
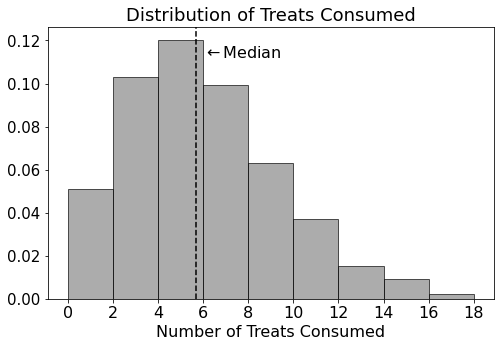
Select the answer closest to the mean of "treats".
4
7
12
Answer: 7
The average score on this problem was 81%.
Select the answer closest to the standard deviation of
"treats".
1
4
16
Answer: 4
The average score on this problem was 85%.
You compute the following statistics about the
"top_speed" column:
mean = 14.6
median = 16.3
You also know that no cat ran at a top speed of exactly 14.6 or 16.3 miles per hour. Select all true statements.
Exactly half of the cats had a top speed greater than 16.3 miles per hour.
There must be at least one cat with a top speed between 14.6 and 16.3 miles per hour.
The output of
(cats.get("top_speed") - 16.3).sum() > 0 is
True.
If we were to add a row to cats for a cat with a top
speed of 20 miles per hour, the median
must increase.
None of the above.
Answer: Options 1 and 4.
The average score on this problem was 73%.