← return to practice.dsc10.com
This quiz was administered in-person. Students were allowed 1
double-sided cheatsheet. Students had 20 minutes to
work on the quiz.
This quiz covered Lectures 16-18 of the Fall 2025 offering of
DSC 10.
Note (groupby / pandas 2.0): Pandas 2.0+ no longer
silently drops columns that can’t be aggregated after a
groupby, so code written for older pandas may behave
differently or raise errors. In these practice materials we use
.get() to select the column(s) we want after
.groupby(...).mean() (or other aggregations) so that our
solutions run on current pandas. On real exams you will not be penalized
for omitting .get() when the old behavior would have
produced the same answer.
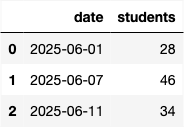
Ryan works at Geisel Library. He counts the number of students on
Geisel’s second floor at 10 AM for some days in summer and fall, storing
them in DataFrames summer (top) and fall
(bottom). The first few rows are shown, along with the mean and standard
deviation of the "students" column.
summer
Mean = 40
SD = 10
fall
Mean = 400
SD = 10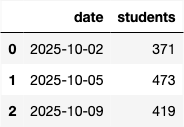
At least what proportion of summer.get("students") is in
the range [30,40]?
\geq 0.75
\geq 0.68
\geq 0.25
\geq 0.00
Answer: \geq 0.00
The average score on this problem was 66%.
Ryan runs the code below to make a single array with the contents of
the "students" columns from both summer and
fall.
combined = np.append(summer.get("students"), fall.get("students"))Select all of the true statements below:
The mean of combined is 220.
The mean of combined is in the range (40,400).
The standard deviation of combined is less than 10.
The standard deviation of combined is greater than
10.
None of the above.
Answer: Options 2 and 4.
The average score on this problem was 83%.
Since he was in a rush, Ryan asked ChatGPT to write code that
standardizes combined. To his surprise, 90\% of the standardized data is
less than 0. Which of the following best explains this situation?
Ryan should be surprised; this must have incorrectly standardized the data.
Ryan should be surprised; a number of students cannot be negative.
Ryan should not be surprised; it’s possible for 100\% of the data to be below 0.
Ryan should not be surprised; his data is skewed.
Answer: Option 4.
The average score on this problem was 66%.
For this question only, suppose we know that
summer.get("students") is normally distributed. You
randomly select one number from summer.get("students").
Using the function scipy.stats.norm.cdf, write one
line of code that evaluates to the probability that the number
you selected is in the range [30,45].
Answer:
scipy.stats.norm.cdf(0.5) - scipy.stats.norm.cdf(-1)
The average score on this problem was 55%.
Ryan writes the following code to obtain a 95% bootstrapped confidence interval for the mean number of students in Geisel’s second floor at 10AM in the fall only:
stats = np.array([])
for i in range(3333):
    stat = fall.sample(fall.shape[0],
                       replace=True).get("students").mean()
    stats = np.append(stats, stat)
lower = np.percentile(stats, 2.5)
upper = np.percentile(stats, 97.5)Write one line of code that evaluates to the upper endpoint of the 95\% CLT-based confidence interval for this same parameter. Recall that some potentially relevant values are provided with the DataFrames on the previous page.
Answer:
400 + 2 * 10 / fall.shape[0] ** 0.5
The average score on this problem was 65%.
True or False: The 95\% confidence interval generated by the bootstrapping code above cannot be narrower than a 95% confidence interval generated by the Central Limit Theorem.
True
False
Answer: False
The average score on this problem was 69%.
True or False: The Central Limit Theorem tells us
that the data in fall.get("students") is roughly normally
distributed.
True
False
Answer: False
The average score on this problem was 62%.
True or False: To obtain a 95% bootstrapped
confidence interval for the median, we can simply change
.mean() to .median() in the original code
above.
True
False
Answer: True
The average score on this problem was 80%.
True or False: We can use the CLT to create a valid 95\% confidence interval for the median.
True
False
Answer: False
The average score on this problem was 86%.
Suppose Ryan is interested in collecting data and using it to form a 95\% confidence interval for the proportion of UCSD students that have ever been to Geisel library.
Write an expression that evaluates to the minimum sample size required for the confidence interval to have a width of at most 0.2.
Answer: (4 * 0.5 / 0.2) ** 2
The average score on this problem was 67%.