← return to practice.dsc10.com
This quiz was administered in-person. Students were allowed 1
double-sided cheatsheet. Students had 20 minutes to
work on the quiz.
This quiz covered Lectures 19-22 of the Fall 2025 offering of
DSC 10.
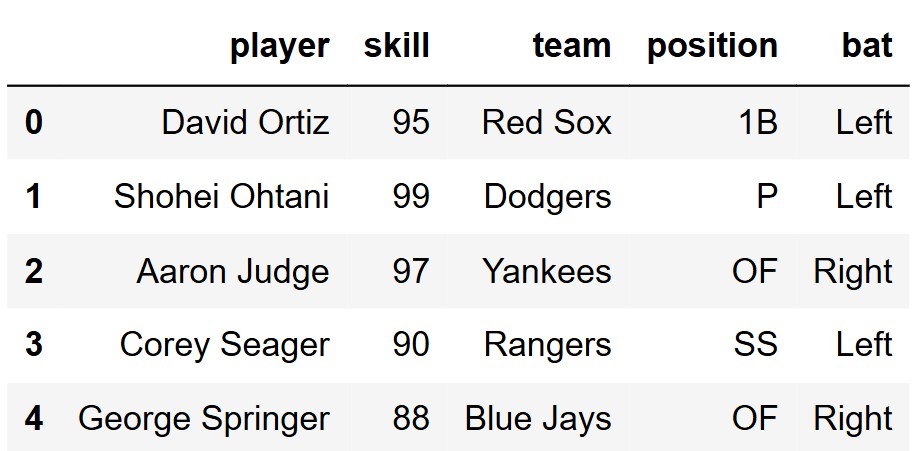
Leander collected a simple random sample of 500 Major League Baseball
players, stored in the DataFrame mlb shown below. The data
includes each player’s name ("player"), overall skill on a
0 to 100 scale ("skill"), "team",
"position", and batting side ("bat"), which
has values "Left" and "Right". Another
DataFrame, soxcards (shown below mlb), was
created to summarize the distribution of positions for two teams, the
Red Sox and the Cardinals, where "IF" represents all
infield positions, including "C", "1B",
"2B", "3B", and "SS".
mlb
soxcards
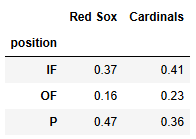
Calculate the TVD between the two distributions in the
soxcards DataFrame.
Answer: 0.11
The average score on this problem was 83%.
Suppose we were to split the "IF" group into all of its
individual positions and their respective proportions. How might the TVD
change? Select all that could be true.
Increase
Decrease
Stay the same
Answer: Options 1 and 3
The average score on this problem was 74%.
Leander conducts a hypothesis test to determine if there is evidence
that players whose batting side is "Left" have higher
"skill" values than those whose batting side is
"Right".
Fill in the blanks to complete the statements of the null and alternative hypotheses.
Null: The mean "skill" of
"Left" batters is ___(a)___ the mean "skill"
of "Right" batters.
Alt: The mean "skill" of
"Left" batters is ___(b)___ the mean "skill"
of "Right" batters.
(a): equal to
(b): greater than
The average score on this problem was 82%.
Select all of the possible test statistics that we could use for this hypothesis test.
The absolute difference in mean "skill" between
"Left" and "Right" batters.
"Left" batters’ maximum "skill" minus
"Right" batters’ maximum "skill".
The TVD between the "skill" distributions for
"Left" and "Right" batters.
None of the above.
Answer: None of the above.
The average score on this problem was 81%.
Fill in the blanks in the code below to perform a permutation test with an appropriate test statistic and compute the p-value.
def get_test_stat(df, column):
    means = df.__(a)__(column).mean().get(__(b)__)
    return means.loc["Left"] - means.loc["Right"]

test_stats = np.array([])
for i in np.arange(5000):
    shuffled_series = np.random.permutation(__(c)__)
    shuffled_df = mlb.assign(shuffled=shuffled_series)
    simulated_test_stat = get_test_stat(__(d)__)
    test_stats = np.append(test_stats, simulated_test_stat)

observed_test_stat = get_test_stat(mlb, "bat")
p_value = np.count_nonzero(__(e)__) / 5000(a): groupby
(b): "skill"
(c): mlb.get("bat")
(d): shuffled df, "shuffled"
(e):
test stats >= observed test stat
The average score on this problem was 67%.
Our test above produces a p-value of 0.038. Select all of the statements below that are true.
At the 0.01 significance level, we fail to reject the null hypothesis.
Using a p-value cutoff of 0.01 results in a test that is 5 times more significant than the test with a p-value cutoff of 0.05.
A p-value is the probability, if the null hypothesis is true, of observing data at least as extreme as what we actually observed.
A p-value of 0.038 means there is a 3.8% chance the null hypothesis is true.
If we used a p-value cutoff of 0.05 and tested many different pairs of hypotheses in which the null hypothesis was actually true, then we would incorrectly reject the null about 5\% of the time.
If we increase the number of repetitions to 10{,}000 the p-value should increase.
If our alternative hypothesis were two-sided instead of one-sided, our p-value would be smaller.
None of the above.
Answer: Options 1, 3, and 5.
The average score on this problem was 89%.