Below are practice problems tagged for Lecture 18
(rendered directly from the original exam/quiz sources).
Source: fa22-final — Q9
Problem 1
After you graduate, you are hired by TritonCard! On your new work
computer, you install numpy, but something goes wrong with
the installation — your copy of numpy doesn’t come with
np.random.multinomial. To demonstrate your resourcefulness
to your new employer, you decide to implement your own version of
np.random.multinomial.
Below, complete the implementation of the function
manual_multinomial so that
manual_multinomial(n, p) works the same way as
np.random.multinomial(n, p). That is,
manual_multinomial should take in an integer n
and an array of probabilities p. It should return an array
containing the counts in each category when we randomly draw
n items from a categorical distribution where the
probabilities of drawing an item from each category are given in the
array p. The array returned by
manual_multinomial(n, p) should have a length of
len(p) and a sum of n.
For instance, to simulate flipping a coin five times, we could call
manual_multinomial(5, np.array([0.5, 0.5])), and the output
might look like array([2, 3]).
The size argument in np.random.choice provides the
number of samples we draw. In the manual_multinomial
function, we randomly draw n items, and so the size should
be n.
Difficulty: ⭐️⭐️
The average score on this problem was 81%.
Problem 1.2
What goes in blank (b)?
Answer:True
Here, we are using np.random.choice to simulate picking
n elements from values. We draw with
replacement since we are allowed to have repeated elements. For example,
if we were flipping a coin five times, we would need to have repeated
elements, since there are only two possible outcomes of a coin flip but
we are flipping the coin more than two times.
Difficulty: ⭐️⭐️
The average score on this problem was 79%.
Problem 1.3
What goes in blank (c)?
Answer:np.count_nonzero(choices == value)
The choices variable contains an array of the
n randomly drawn values selected from values.
In each iteration of the for-loop, we want to count the number of
elements in choices that are equal to the given
value. To do this, we can use
np.count_nonzero(choices == value). In the end,
value_counts is an array that says how many times we
selected 0, how many times we selected 1, and so on.
Difficulty: ⭐️⭐️⭐️⭐️
The average score on this problem was 37%.
Source: fa23-quiz4 — Q2
Problem 2
You want to estimate the proportion of DSC majors who have a Netflix
subscription. To do so, you will survey a random sample of DSC majors
and ask them whether they have a Netflix subscription. You will then
create a 95% confidence interval for the proportion of “yes" answers in
the population, based on the responses in your sample. You decide that
your confidence interval should have a width of at most 0.10.
Problem 2.1
In order for your confidence interval to have a width of at most
0.10, the standard deviation of the distribution of the sample
proportion must be at most T. What is
T? Give your answer as an exact
decimal.
Answer: 0.025
Difficulty: ⭐️⭐️⭐️⭐️
The average score on this problem was 46%.
Problem 2.2
Using the fact that the standard deviation of any dataset of 0s and
1s is no more than 0.5, calculate the minimum number of people you would
need to survey so that the width of your confidence interval is at most
0.10. Give your answer as an integer.
Answer: 400
Difficulty: ⭐️⭐️
The average score on this problem was 81%.
Source: fa24-quiz4 — Q1
Problem 3
We plan to collect a sample of movies and use this sample to estimate
the proportion of all movies with the genre "Musical", a
population parameter.
Problem 3.1
If we want to create a 95\%
confidence interval that is at most 0.08 wide, which of the expressions below
represents the smallest sample size we should collect?
\left(\dfrac{1}{0.02}\right)^2
\left(\dfrac{1}{0.04}\right)^2
\left(\dfrac{1}{0.08}\right)^2
\left(\dfrac{1}{0.16}\right)^2
Answer: \left(\dfrac{1}{0.04}\right)^2
Difficulty: ⭐️⭐️⭐️⭐️
The average score on this problem was 41%.
Problem 3.2
Let W represent the maximum width of
a 95\% confidence interval obtained
from a sample that is twice as big as the sample size
you found in part (a). Which of the following is true?
0 < W < 0.04
W = 0.04
0.04 < W < 0.08
W \geq 0.08
Answer: 0.04 < W <
0.08
Difficulty: ⭐️⭐️⭐️
The average score on this problem was 56%.
Source: fa25-quiz4 — Q5
Problem 4
Suppose Ryan is interested in collecting data and using it to form a
95\% confidence interval for the
proportion of UCSD students that have ever been to Geisel
library.
Write an expression that evaluates to the minimum sample size
required for the confidence interval to have a width of at most 0.2.
Answer: (4 * 0.5 / 0.2) ** 2
Difficulty: ⭐️⭐️⭐️
The average score on this problem was 67%.
Source: sp24-final — Q6
Problem 5
You want to use the data in apts to test both of the
following pairs of hypotheses:
Pair 1:
Null Hypothesis: In San Diego, the number of one
bedroom apartments available for rent is equal to the
number of two bedroom apartments available for rent.
Alternate Hypothesis: In San Diego, the number of
one bedroom apartments available for rent is greater to
the number of two bedroom apartments available for rent.
Pair 2:
Null Hypothesis: In San Diego, the number of one
bedroom apartments available for rent is equal to the
number of two bedroom apartments available for rent.
Alternate Hypothesis: In San Diego, the number of
one bedroom apartments available for rent is not equal
to the number of two bedroom apartments available for rent.
In apts, there are 467 apartments that are either one
bedroom or two bedroom apartments. You perform the following simulation
under the assumption of the null hypothesis.
From the given percentiles, we can notice that since the distribution
is symmetric around the mean, the mean should be around the 50th
percentile. Given the symmetry and the percentiles around 0.5, we can
infer that the mean should be very close to 0.5.
Another way we can look at it is by noticing that prop
is pulled from a [0.5, 0.5]
distribution (because we are simulating under the null hypotheses) in
np.random.multinomial(). This means that its expected for
most of the distribution to be from around 0.5.
Difficulty: ⭐️⭐️
The average score on this problem was 84%.
Problem 5.2
What is np.std(prop_1br) to two decimal places?
Answer:0.05
If we look again at the percentiles, we notice that it seems to
resemble a normal distribution. So by taking the mean and the 97.5th
percentile, we can solve for the standard deviation. Since [2.5, 97.5] is the 95% confidence interval,
we can say that the 97.5th percentile is two standard deviations away
from the mean (2.5 too!). Thus,
0.5 + 2 \cdot \text{SD} = 0.6
\therefore Solving for SD, we get
\text{SD} = 0.05
Difficulty: ⭐️⭐️⭐️⭐️
The average score on this problem was 45%.
Problem 5.3
What is np.percentile(abs_diff, 95) to two decimal
places?
Answer:0.1
Each time through our for-loop, we execute the following lines of
code:
prop_1br = np.append(prop_1br, prop)
abs_diff = np.append(abs_diff, np.abs(prop-0.5))
Additionally, we’re told the following statements evaluate to
True:
np.percentiles(prop_1br, 2.5) == 0.4
np.percentiles(prop_1br, 5) == 0.42
np.percentiles(prop_1br, 95) == 0.58
np.percentiles(prop_1br, 97.5) == 0.6
We can combine these pieces of information to find the answer to this
question.
First, consider the shape of the distribution of
prop_1br. We know it’s symmetrical around 0.5, and beyond
that, we can infer that it’s a normal distribution.
Now, think about how this relates to the distribution of
abs_diff. abs_diff is generated by finding the
absolute difference between prop_1br and 0.5. Because of
this, abs_diff is an array of distances (which are nonnegative by
definition) from 0.5.
We know that prop_1br is normal, and symmetrical about
0.5. So, the distribution of how far away prop_1br is from
0.5 will look like we took the distribution of prop_1br,
moved it to be centered at 0, and folded it in half so that all negative
values become positive. This is because the previous center at 0.5
represents a distance of 0 from 0.5. Similarly, a value of 0.6 would
represent a distance of 0.1 from 0.5, and a value of 0.4 would also
represent a distance of 0.1 from 0.5.
Now, the problem becomes much simpler to solve. Before, we were told
that 95% of our the in prop_1br lies between 0.4 and 0.6
(Thanks to the lines of code that evaluate to True). This is the same as
telling us that 95% of the data in prop_1br lies within a
distance of 0.1 to 0.5 (Because 0.4 and 0.6 are both 0.1 away from
0.5).
Because of this, the 95% percentile of abs_diff is 0.1, since 95% of
the data in prop_1br lies within a distance of 0.1 to 0.5
(meaning that 95% of the data in abs_diff is between 0 and 0.1).
Difficulty: ⭐️⭐️⭐️⭐️⭐️
The average score on this problem was 10%.
Problem 5.4
Which simulated test statistics should be used to test the first pair
of hypotheses?
prop_1br
abs_diff
Answer:prop_1br
Our first pair of hypotheses’ alternative hypothesis asks if one
number is greater than the other. Because of this, we
can’t use an absolute value test statistic to answer the question, since
all absolute value cares about is the distance the simulation is from
the null assumption, not whether one value is greater than the
other.
Difficulty: ⭐️⭐️
The average score on this problem was 82%.
Problem 5.5
Which simulated test statistics should be used to test the second
pair of hypotheses?
prop_1br
abs_diff
Answer:abs_diff
Our first pair of hypotheses’ alternative hypothesis asks if one
number is not equal to the other. Because of this, we
have to use a test statistic that sees the distance both ways, not just
in one direction. Therefore, we use the absolute value.
Difficulty: ⭐️⭐️
The average score on this problem was 83%.
Problem 5.6
Your observed data in apts is such that you reject the
null for the first pair of hypotheses at the 5% significance level, but
fail to reject the null for the second pair at the 5% significance
level. What could the value of the following proportion have been?
\frac{\text{\# of one bedroom apartments
in \texttt{apts}}}{\text{\# of one bedroom apartments in \texttt{apts}+
\# of two bedroom apartments in \texttt{apts}}}
Give your answer as a number to two decimal places.
Answer:0.59
Difficulty: ⭐️⭐️⭐️⭐️⭐️
The average score on this problem was 20%.
Source: sp24-quiz4 — Q3
Problem 6
Suppose we measure the height in feet of a sample of trees on UCSD’s
campus and use this sample to generate a 95% CLT-based confidence
interval for the mean height of trees on campus. Let W be the width of this confidence
interval.
If we instead were to measure the height of the same sample in
inches, and again generate a 95% CLT-based confidence interval for the
mean, what would be the width of this confidence interval in terms of
W? There are 12 inches in 1 foot.
\dfrac{W}{12}
\dfrac{W}{\sqrt{12}}
W
12W
144W
Answer: 12W
Difficulty: ⭐️⭐️⭐️
The average score on this problem was 63%.
Source: sp24-quiz4 — Q5
Problem 7
We want to collect a sample of trees and use this sample to determine
the proportion of all trees that are oak trees (a population parameter).
We want to create a 95% confidence interval that is at most 0.04 wide.
Which of the following inequalities should we use to find the smallest
viable sample size we could collect?
Suppose that the trees on UCSD’s campus are 35% eucalyptus, 25% pine,
and the remaining 40% some other variety. Write one line of
code to simulate the act of randomly sampling 40 trees from
this distribution, with replacement. Your code should output an array of
length 3 where the elements represent the number of eucalyptus, pine,
and other trees, respectively.
Suppose you want to estimate the proportion of UCSD students that
love dogs using a survey with a yes/no question. If you poll 400
students, what is the widest possible width for a 95% confidence
interval?
0.01
0.05
0.1
0.2
0.5
None of the above
Answer: Option 3: 0.1
Since, we’re looking at a proportion of UCSD students that love dogs,
we’ll set a “yes” vote to a value of 1 and a “no” vote to a value of 0.
(Try to see why this makes the mean of “yes”/“no” votes also the
proportion of “yes” votes). Also by central limit theorem, the
distribution of the sample mean is approximately normal. Now recall that
a 95% confidence interval of a sample mean is given by
[sample mean - 2 * (sample std / np.sqrt(sample size)), sample mean + 2 * (sample std / np.sqrt(sample size))].
As a result, we realize that the width of a 95% confidence interval is
4 * (sample std / np.sqrt(sample size)). Now, the sample
size is already constant, which was given to be 400. However, we can
attempt to maximize the sample std. It’s not hard to see
that the maximum std we could achieve is by recieving an equal number of
yes/no votes (aka 200 of each vote). Calculating the standard deviation
in this case is just 0.5*, and so the widest possible width for a 95%
confidence interval is just 4 * 0.5/np.sqrt(400) which
evaluates to 0.1.
*To make the calculation of the standard deviation faster, try to see
why calculating the std of a dataset with 200 1’s and 200 0’s is the
same as calculating the std of a data set with only a single 1 and a
single 0.
Difficulty: ⭐️⭐️⭐️⭐️
The average score on this problem was 34%.
Problem 10
Suppose you draw a sample of size 100 from a population with mean 50
and standard deviation 15. What is the probability that your sample has
a mean between 50 and 53? Input the probability below, as a number
between 0 and 1, rounded to two decimal places.
Answer: 0.48
This problem is testing our understanding of the Central Limit
Theorem and normal distributions. Recall, the Central Limit Theorem
tells us that the distribution of the sample mean is roughly normal,
with the following characteristics:
\begin{align*}
\text{Mean of Distribution of Possible Sample Means} &=
\text{Population Mean} = 50 \\
\text{SD of Distribution of Possible Sample Means} &=
\frac{\text{Population SD}}{\sqrt{\text{Sample Size}}} =
\frac{15}{\sqrt{100}} = 1.5
\end{align*}
Given this information, it may be easier to express the problem as
“We draw a value from a normal distribution with mean 50 and SD 1.5.
What is the probability that the value is between 50 and 53?” Note that
this probability is equal to the proportion of values between 50
and 53 in a normal distribution whose mean is 50 and 1.5 (since
probabilities can be thought of as proportions).
In class, we typically worked with the standard normal
distribution, in which the mean was 0, the SD was 1, and the x-axis represented values in standard units.
Let’s convert the quantities of interest in this problem to standard
units, keeping in mind that the mean and SD we’re using now are the mean
and SD of the distribution of possible sample means, not of the
population.
50 converted to standard units is \frac{50
- \text{mean}}{\text{SD}} = \frac{50 - 50}{1.5} = 0 (no
calculation was necessary – 0 in standard units is equal to the mean in
original units).
53 converted to standard units is \frac{53
- \text{mean}}{\text{SD}} = \frac{53 - 50}{1.5} = 2.
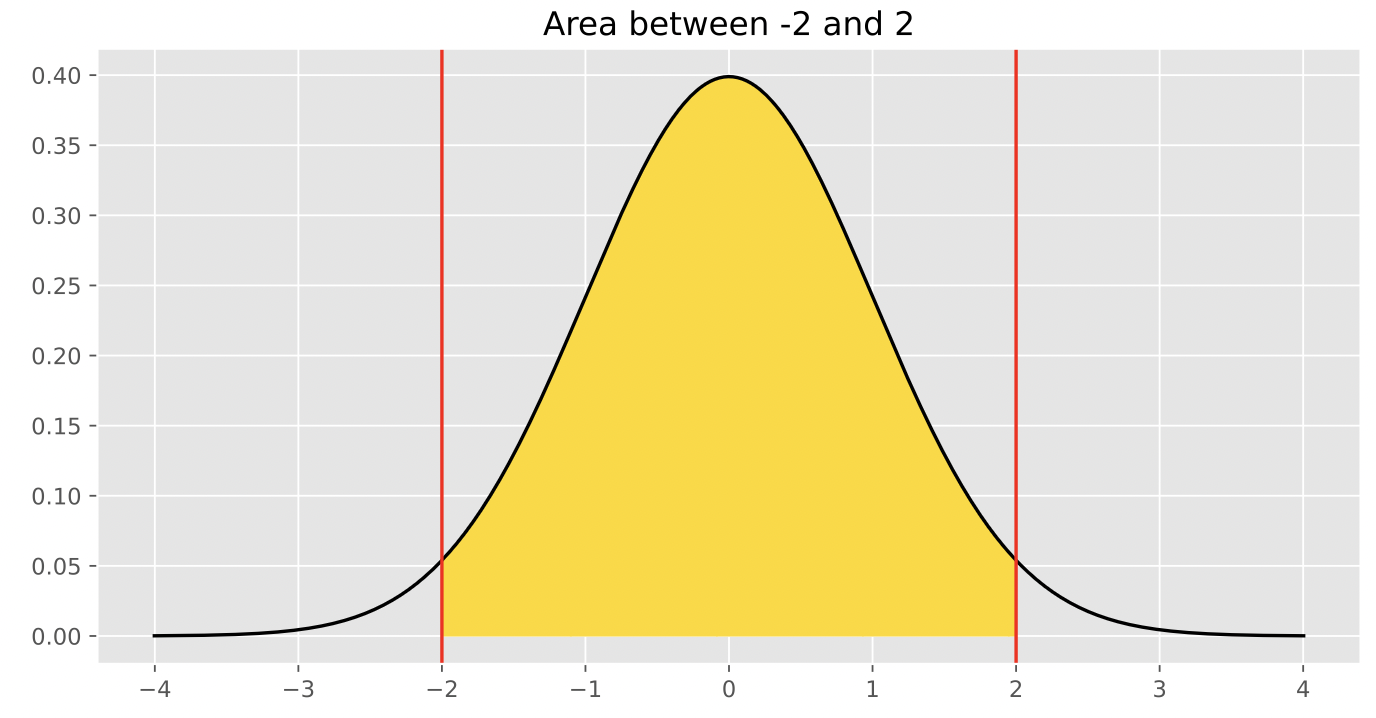
Now, our problem boils down to finding the proportion of
values in a standard normal distribution that are between 0 and
2, or the proportion of values in a normal distribution
that are in the interval [\text{mean},
\text{mean} + 2 \text{ SDs}].
From class, we know that in a normal distribution, roughly 95% of
values are within 2 standard deviations of the mean, i.e. the proportion
of values in the interval [\text{mean} - 2
\text{ SDs}, \text{mean} + 2 \text{ SDs}] is 0.95.
Since the normal distribution is symmetric about the mean, half of
the values in this interval are to the right of the mean, and half are
to the left. This means that the proportion of values in the interval
[\text{mean}, \text{mean} + 2 \text{
SDs}] is \frac{0.95}{2} = 0.475,
which rounds to 0.48, and thus the desired result is 0.48.
Difficulty: ⭐️⭐️⭐️⭐️
The average score on this problem was 48%.
Problem 11
You need to estimate the proportion of American adults who want to be
vaccinated against Covid-19. You plan to survey a random sample of
American adults, and use the proportion of adults in your sample who
want to be vaccinated as your estimate for the true proportion in the
population. Your estimate must be within 0.04 of the true proportion,
95% of the time. Using the fact that the standard deviation of any
dataset of 0’s and 1’s is no more than 0.5, calculate the minimum number
of people you would need to survey. Input your answer below, as an
integer.
Answer: 625
Note: Before reviewing these solutions, it’s highly recommended
to revisit the lecture on “Choosing Sample Sizes,” since this problem
follows the main example from that lecture almost exactly.
While this solution is long, keep in mind from the start that our
goal is to solve for the smallest sample size necessary
to create a confidence interval that achieves certain criteria.
The Central Limit Theorem tells us that the distribution of the
sample mean is roughly normal, regardless of the distribution of the
population from which the samples are drawn. At first, it may not be
clear how the Central Limit Theorem is relevant, but remember that
proportions are means too – for instance, the proportion of adults who
want to be vaccinated is equal to the mean of a collection of 1s and 0s,
where we have a 1 for each adult that wants to be vaccinated and a 0 for
each adult who doesn’t want to be vaccinated. What this means (😉) is
that the Central Limit Theorem applies to the distribution of
the sample proportion, so we can use it here too.
Not only do we know that the distribution of sample proportions is
roughly normal, but we know its mean and standard deviation, too:
\begin{align*}
\text{Mean of Distribution of Possible Sample Means} &=
\text{Population Mean} = \text{Population Proportion} \\
\text{SD of Distribution of Possible Sample Means} &=
\frac{\text{Population SD}}{\sqrt{\text{Sample Size}}}
\end{align*}
Using this information, we can create a 95% confidence interval for
the population proportion, using the fact that in a normal distribution,
roughly 95% of values are within 2 standard deviations of the mean:
However, this interval depends on the population proportion (mean)
and SD, which we don’t know. (If we did know these parameters, there
would be no need to collect a sample!) Instead, we’ll use the sample
proportion and SD as rough estimates:
Note that the width of this interval – that is, its right endpoint
minus its left endpoint – is: \text{width} =
4 \cdot \frac{\text{Sample SD}}{\sqrt{\text{Sample Size}}}
In the problem, we’re told that we want our interval to be accurate
to within 0.04, which is equivalent to wanting the width of our interval
to be less than or equal to 0.08 (since the interval extends the same
amount above and below the sample proportion). As such, we need to pick
the smallest sample size necessary such that:
All we now need to do is pick the smallest sample size that satisfies
the above inequality. But there’s an issue – we don’t know what
our sample SD is, because we haven’t collected our sample!
Notice that in the inequality above, as the sample SD increases, so does
the minimum necessary sample size. In order to ensure we don’t collect
too small of a sample (which would result in the width of our confidence
interval being larger than desired), we can use an upper bound
for the SD of our sample. In the problem, we’re told that the largest
possible SD of a sample of 0s and 1s is 0.5 – this means that if we
replace our sample SD with 0.5, we will find a sample size such that the
width of our confidence interval is guaranteed to be less than or equal
to 0.08. This sample size may be larger than necessary, but that’s
better than it being smaller than necessary.
By substituting 0.5 for the sample SD in the last inequality above,
we get
We need to pick the smallest possible sample size that is greater
than or equal to 625; that’s just 625.
Difficulty: ⭐️⭐️⭐️⭐️
The average score on this problem was 40%.
Source: wi23-final — Q10
Problem 12
It’s your first time playing a new game called Brunch Menu.
The deck contains 96 cards, and each player will be dealt a hand of 9
cards. The goal of the game is to avoid having certain cards, called
Rotten Egg cards, which come with a penalty at the end of the
game. But you’re not sure how many of the 96 cards in the game are
Rotten Egg cards. So you decide to use the Central Limit
Theorem to estimate the proportion of Rotten Egg cards in the deck based
on the 9 random cards you are dealt in your hand.
Problem 12.1
You are dealt 3 Rotten Egg cards in your hand of 9 cards. You then
construct a CLT-based 95% confidence interval for the proportion of
Rotten Egg cards in the deck based on this sample. Approximately, how
wide is your confidence interval?
Choose the closest answer, and use the following facts:
The standard deviation of a collection of 0s and 1s is \sqrt{(\text{Prop. of 0s}) \cdot (\text{Prop of
1s})}.
\sqrt{18} is about \frac{17}{4}.
\frac{17}{9}
\frac{17}{27}
\frac{17}{81}
\frac{17}{96}
Answer:\frac{17}{27}
A Central Limit Theorem-based 95% confidence interval for a
population proportion is given by the following:
Note that this interval uses the fact that (about) 95% of values in a
normal distribution are within 2 standard deviations of the mean. It’s
key to divide by \sqrt{\text{Sample
Size}} when computing the standard deviation because the
distribution that is roughly normal is the distribution of the sample
mean (and hence, sample proportion), not the distribution of the sample
itself.
The width of the above interval – that is, the right endpoint minus
the left endpoint – is
Which of the following are limitations of trying to use the Central
Limit Theorem for this particular application? Select all that
apply.
The CLT is for large random samples, and our sample was not very
large.
The CLT is for random samples drawn with replacement, and our sample
was drawn without replacement.
The CLT is for normally distributed data, and our data may not have
been normally distributed.
The CLT is for sample means and sums, not sample proportions.
Answer: Options 1 and 2
Option 1: We use Central Limit Theorem (CLT) for
large random samples, and a sample of 9 is considered to be very small.
This makes it difficult to use CLT for this problem.
Option 2: Recall CLT happens when our sample is
drawn with replacement. When we are handed nine cards we are never
replacing cards back into our deck, which means that we are sampling
without replacement.
Option 3: This is wrong because CLT states that a
large sample is approximately a normal distribution even if the data
itself is not normally distributed. This means it doesn’t matter if our
data had not been normally distributed if we had a large enough sample
we could use CLT.
Option 4: This is wrong because CLT does apply to
the sample proportion distribution. Recall that proportions can be
treated like means.
Difficulty: ⭐️⭐️
The average score on this problem was 77%.
Source: wi24-final — Q5
Problem 13
In figure skating, skaters move around an ice rink performing a
series of skills, such as jumps and spins. Ylesia has been training for
the Olympics, and she has a set routine that she plans to perform.
Let’s say that Ylesia performs a skill successfully if she does not
fall during that skill. Each skill comes with its own probability of
success, as some skills are harder and some are easier. Suppose that the
probabilities of success for each skill in Ylesia’s Olympic routine are
stored in an array called skill_success.
For example, if Ylesia’s Olympic routine happened to only contain
three skills, skill_success might be the array with values
0.92, 0.84, 0.92. However, her routine can contain any number of
skills.
Problem 13.1
Ylesia wants to simulate one Olympic routine to see how many times
she might fall. Fill in the function count_falls below,
which takes as input an array skill_success and returns as
output the number of times Ylesia falls during her Olympic routine.
def count_falls(skill_success): falls =0for p in skill_success: result = np.random.multinomial(1, __(a)__) falls = __(b)__return falls
(a) First, we should think about what
np.random.multinomial is trying to do here. It’s trying to make an array
of how many times each scenario happened. There are 2 possible scenarios
here: Ylesia succeeds or Ylesia fails. In this code, p is the
probability that Ylesia succeeds a skill, and therefore the probabilty
that Ylesia does not succeed (she fails) will be 1-p. So to properly
simulate how many times she falls, we should put [p, 1-p]
in blank (a).
(b) Our answer from (a) will make an array stored
in result, with index 0 being how many times she succeeded
(corresponds to p), and index 1 being how many times she fell
(corresponds to 1-p). Since index 1 corresponds to the scenario in which
she falls, in order to correctly increase the number of falls, we add
falls by result[1]. Therefore, blank (b) is
falls + result[1].
Likewise, you can change the order with (a): [1-p, p]
and (b): falls + result[0] and it would still correctly
simulate how many times she falls.
Difficulty: ⭐️⭐️⭐️
The average score on this problem was 59%.
Problem 13.2
Fill in the blanks below so that prob_no_falls evaluates
to the exact probability of Ylesia performing her entire routine without
falling.
prob_no_falls = __(a)__for p in skill_success: prob_no_falls = __(b)__ prob_no_falls
Answer: (a): 1, (b):
prob_no_falls * p
(a) We start with the initial value of
prob_no_falls. This should be set to 1 because we’re
computing a probability product, and starting with 1 ensures the initial
value doesn’t affect the multiplication of subsequent
probabilities.
(b) Inside the for-loop, we want to update
prob_no_falls by multiplying it by each probability of
success (p) in skill_success. This is because
the probability of Ylesia not falling throughout multiple independent
skills is the product of her not falling during each skill.
Difficulty: ⭐️⭐️⭐️
The average score on this problem was 72%.
Problem 13.3
Fill the blanks below so that approx_prob_no_falls
evaluates to an estimate of the probability that Ylesia performs her
entire routine without falling, based on 10,000 trials. Feel free to use
the function you defined in part (a) as part of your solution.
results = np.array([])for i in np.arange(10000): results = np.append(results, __(a)__) approx_prob_no_falls = __(b)__ approx_prob_no_falls
Answer:(a): count_falls(skill_success),
(b): np.count_nonzero(results == 0) / 10000, though there
are many other correct solutions
(a) For this question, we are doing a simulation
where we calculate the probability of Ylesia not falling during her
routine based on 10,000 trials. To do so, we want to find out the number
of times that Yelsia did not fall any skill during her routine out of
the 10,000 trials. Based on the given codes, we have an array where we
are appending something into that array for each trial. We can utilize
the function defined in part a to calculate the number of times Ylesia
falls during a single trial so blank a will be
count_falls(skill_success).
(b) After 10,000 iterations, we have an array of
the number of falls for each trial. Then, we want to count the number of
times that we get 0 in that array, which means Ylesia did not fall.
Lastly, to get the probability, we will need to divide by the total
number of trials which is 10,000. This gives us the answer for blank b:
np.count_nonzero(results == 0) / 10000.
Difficulty: ⭐️⭐️⭐️
The average score on this problem was 66%.
Source: wi24-quiz5 — Q1
Problem 14
Problem 14.1
Suppose you want to estimate the proportion of UCSD students that
prefer sunny days over rainy days. You plan to survey 900 students, then
construct a 95% confidence interval for this proportion. What is the
widest possible width for the resulting confidence
interval? Give your answer as a fully simplified
fraction.
Answer:\frac{1}{15}
Difficulty:
⭐️⭐️⭐️⭐️
The average score on this problem was 38%.
Problem 14.2
If you decide to survey 450 students instead of 900 students for your
sample, the maximum possible width of your 95% confidence interval
would:
double
increase by more than double
increase by less than double
Answer: increase by less than double
Difficulty: ⭐️⭐️⭐️
The average score on this problem was 60%.
Source: wi25-final — Q10
Problem 15
Bertie Bott’s Every Flavor Beans are a popular treat in the wizarding
world. They are jellybean candies sold in boxes of 100
beans, containing a variety of flavors including chocolate,
peppermint, spinach, liver, grass, earwax, and paper. Luna’s favorite
flavor is bacon.
Luna wants to estimate the proportion of bacon-flavored beans
produced at the Bertie Bott’s bean factory. She buys a box of Bertie
Bott’s Every Flavor Beans and finds that 4 of the 100
beans inside are bacon-flavored. Using this sample, she decides
to construct an 86\% CLT-based
confidence interval for the proportion of bacon-flavored beans
produced at the factory.
Problem 15.1
Let’s begin by solving a related problem that will help us in the
later parts of this question. Consider the following fact:
For a sample of size 100 consisting of 0’s and 1’s,
the maximum possible width of an 86\%
CLT-based confidence interval is approximately 0.15.
Use this fact to find the value of z such that
scipy.stats.norm.cdf(z) evaluates to 0.07.
Give your answer as a number to one decimal place.
Answer:-1.5
The 86% confidence interval for the population mean is given by:
We solve for |z|. The maximum width
of our CI is given to be 0.15, so we
must also use the maximum possible standard deviation, 0.5. we substitute the known values to
obtain:
0.15 = 2 \cdot |z| \cdot \frac{0.5}{\sqrt{100}}
which leaves |z| = 1.5 after
computation. To find the z such that
scipy.stats.norm.cdf(z) evaluates to 0.07, we
realize that z is the point under the
normal curve, in standard units, left of which represents 7\% of the area under the entire curve. Note
that scipy.stats.norm.cdf(0) evaluates to 0.5
(Recall: half of the area is left of the mean, which is zero in standard
units). We must therefore take a negative value for z. Thus z =
-1.5.
Difficulty: ⭐️⭐️⭐️
The average score on this problem was 55%.
Problem 15.2
Suppose that Luna’s sample has a standard deviation of 0.2. What are the endpoints of her 86\% confidence interval? Give each endpoint
as a number to two decimal places.
Answer:[0.01, \
0.07]
Recall the formula for the width of an 86\% confidence interval:
where we found |z| = 1.5 in part
(a). Instead of using the maximum sample SD, we will now use 0.2 and compute the new width of the
confidence interval. This results in
Since this is a CLT-based confidence interval for the population
mean, the interval must be centered at the mean. We compute the interval
using the structure from part (a), which leaves
Hermione thinks she can do a better job of estimating the proportion
of bacon-flavored beans, though she’ll need a bigger sample to do so.
Hermione will collect a new sample and use it to construct another 86\% confidence interval for the same
parameter.
Under the assumption that Hermione’s sample will have the same
standard deviation as Luna’s sample, which was 0.2, how many
boxes of Bertie Bott’s Every Flavor Beans must Hermione buy to
guarantee that the width of her 86\%
confidence interval is at most 0.012?
Give your answer as an integer.
Remember: There are 100 beans in each box.
Answer:25
boxes
Recall the formula for the width of an 86\% confidence interval:
where we must again use the fact that |z| =
1.5 from part (a). Here, we want a width that is no
larger than 0.012,
given that our sample SD remains 0.2. Plugging everything in:
0.012 \geq 2 \cdot 1.5 \cdot \frac{0.2}{\sqrt{n}}
Rearranging the expression to solve for n, we get
\begin{align*}
n &\geq \left( \frac{3 \cdot 0.2}{0.012} \right)^2 \\
n &\geq \left( \frac{600}{12} \right)^2 \\
n &\geq (50)^2 \\
n &\geq 2500
\end{align*}
However, 2500 isn’t our final
answer. The question asks for the number of boxes
Hermione must buy, given that each box contains 100 beans. The bound we
computed above for n corresponds to the
minimum number of beans Hermione must observe. To get
the minimum number of boxes, we simply divide the bound by 100. The final answer is 25 boxes.
Difficulty: ⭐️⭐️⭐️⭐️
The average score on this problem was 37%.
Source: wi25-quiz4 — Q1
Problem 16
You want to estimate the proportion of all flower fields in the world
that use fertilizer. You will create a 68% confidence
interval for this proportion, based on a sample of flower
fields. You want your confidence interval to have a width of at
most 0.01. Using the fact that the standard deviation of any
dataset of 0s and 1s is no more than 0.5, calculate the minimum
sample size required. Give your answer as an
integer.
Answer: 10,000
Difficulty: ⭐️⭐️⭐️
The average score on this problem was 53%.
Source: wi26-quiz4 — Q4
Problem 17
After finding out through his expertly constructed permutation test
that Jeffrey did, in fact, grade significantly harder than Kate,
Detective Peter resolves to estimate the proportion of
Jeffrey’s graded submissions that received a score below 70. He will
construct a 95% CLT-based confidence interval for this
proportion.
Problem 17.1
(a) He wants the confidence interval to have
width at most 0.08. What is the
minimum number of Jeffrey’s submissions he needs?
Answer:625
For a 95% CLT-based interval for a proportion, use \hat{p}=0.5 (conservative). Requiring width
at most 0.08 leads to minimum n = 625.
Difficulty: ⭐️⭐️⭐️
The average score on this problem was 53%.
Problem 17.2
(b) Suppose he instead wants the width to be
at most 0.04. The minimum sample size for that width is
how many times the minimum sample size from part
(a)?
Answer:4
CI width scales like 1/\sqrt{n}, so
halving the width requires multiplying n by 2^2 =
4. Thus the new minimum sample size is 4 times the minimum from
part (a).