← return to practice.dsc10.com
Below are practice problems tagged for Lecture 5 (rendered directly from the original exam/quiz sources).
In this question, we’ll keep working with the
art_museums DataFrame.
(Remember to keep the data description from the top of the exam open in another tab!)
'Tate Modern' is the most popular art museum in London.
But what’s the most popular art museum in each city?
It turns out that there’s no way to answer this easily using the
tools that you know about so far. To help, we’ve created a new Series
method, .last(). If s is a Series,
s.last() returns the last element of s
(i.e. the element at the very end of s).
.last() works with .groupby, too (just like
.mean() and .count()).
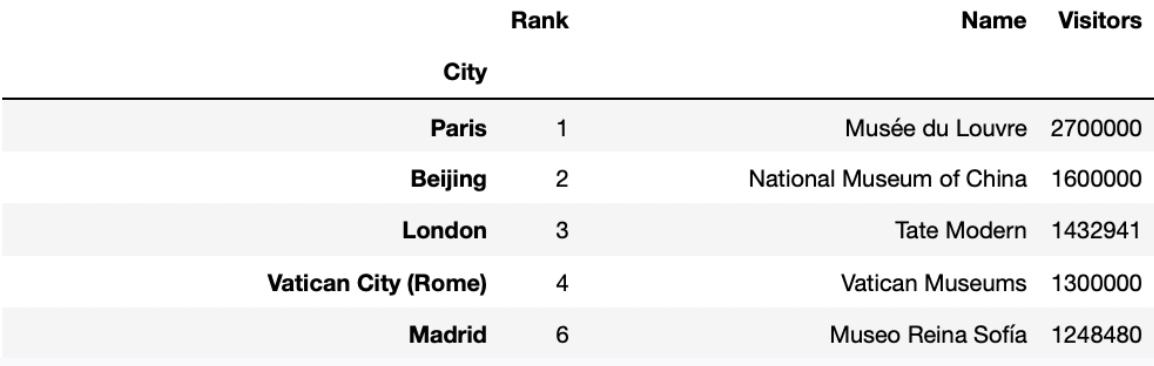
Fill in the blanks so that the code below correctly assigns
best_per_city to a DataFrame with one row per city, that
describes the name, number of visitors, and rank of the most visited art
museum in each city. best_per_city should be sorted in
decreasing order of number of visitors. The first few rows of
best_per_city are shown below.
best_per_city = __(a)__.groupby(__(b)__).last().__(c)__Answers:
art_museums.sort_values('Visitors', ascending=True)'City'sort_values('Visitors', ascending=False)Let’s take a look at the completed implementation.
best_per_city = art_museums.sort_values('Visitors', ascending=True).groupby('City').last().sort_values('Visitors', ascending=False)We first sort the row in art_museums by the number of
'Visitors' in ascending order. Then
groupby('City'), so that we have one row per city. Recall,
we need an aggregation method after using groupby(). In
this question, we use last() to only keep the one last row
for each city. Since in blank (a) we have sorted the rows by
'Visitors', so last() keeps the row that
contains the name of the most visited museum in that city. At last we
sort this new DataFrame by 'Visitors' in descending order
to fulfill the question’s requirement.
The average score on this problem was 65%.
Assume you’ve defined best_per_city correctly.
Which of the following options evaluates to the number of visitors to the most visited art museum in Amsterdam? Select all that apply.
best_per_city.get('Visitors').loc['Amsterdam']
best_per_city[best_per_city.index == 'Amsterdam'].get('Visitors').iloc[0]
best_per_city[best_per_city.index == 'Amsterdam'].get('Visitors').iloc[-1]
best_per_city[best_per_city.index == 'Amsterdam'].get('Visitors').loc['Amsterdam']
None of the above
Answer:
best_per_city.get('Visitors').loc['Amsterdam'],
best_per_city[best_per_city.index == 'Amsterdam'].get('Visitors').iloc[0],
best_per_city[best_per_city.index == 'Amsterdam'].get('Visitors').iloc[-1],
best_per_city[best_per_city.index == 'Amsterdam'].get('Visitors').loc['Amsterdam']
(Select all except “None of the above”)
best_per_city.get('Visitors').loc['Amsterdam'] We first
use .get(column_name) to get a series with number of
visitors to the most visited art museum, and then locate the number of
visitors to the most visited art museum in Amsterdam using
.loc[index] since we have "City" as index.
best_per_city[best_per_city.index == 'Amsterdam'].get('Visitors').iloc[0]
We first query the best_per_city to only include the
DataFrame with one row with index 'Amsterdam'. Then, we get
the 'Visitors' column of this DataFrame. Finally, we use
iloc[0] to access the first and the only value in this
column.
best_per_city[best_per_city.index == 'Amsterdam'].get('Visitors').iloc[-1]
We first query the best_per_city to only include the
DataFrame with one row with index 'Amsterdam'. Then, we get
the 'Visitors' column of this DataFrame. Finally, we use
iloc[-1] to access the last and the only value in this
column.
best_per_city[best_per_city.index == 'Amsterdam'].get('Visitors').loc['Amsterdam']
We first query the best_per_city to only include the
DataFrame with one row with index 'Amsterdam'. Then, we get
the 'Visitors' column of this DataFrame. Finally, we use
loc['Amsterdam'] to access the value in this column with
index 'Amsterdam'.
The average score on this problem was 84%.
Which of these correctly evaluates to the number of flights King
Triton took to San Diego (airport code 'SAN')?
flights.loc['SAN'].shape[0]
flights[flights.get('TO') == 'SAN'].shape[0]
flights[flights.get('TO') == 'SAN'].shape[1]
len(flights.sort_values('TO', ascending=False).loc['SAN'])
Answer:
flights[flights.get('TO') == 'SAN'].shape[0]
The strategy is to create a DataFrame with only the flights that went
to San Diego, then count the number of rows. The first step is to query
with the condition flights.get('TO') == 'SAN' and the
second step is to extract the number of rows with
.shape[0].
Some of the other answer choices use .loc['SAN'] but
.loc only works with the index, and flights
does not have airport codes in its index.
The average score on this problem was 95%.
Fill in the blanks below so that the result also evaluates to the
number of flights King Triton took to San Diego (airport code
'SAN').
flights.groupby(__(a)__).count().get('FLIGHT').__(b)__ What goes in blank (a)?
'DATE'
'FLIGHT'
'FROM'
'TO'
What goes in blank (b)?
.index[0]
.index[-1]
.loc['SAN']
.iloc['SAN']
.iloc[0]
True or False: If we change .get('FLIGHT') to
.get('SEAT'), the results of the above code block will not
change. (You may assume you answered the previous two subparts
correctly.)
True
False
Answer: 'TO',
.loc['SAN'], True
The strategy here is to group all of King Triton’s flights according
to where they landed, and count up the number that landed in San Diego.
The expression flights.groupby('TO').count() evaluates to a
DataFrame indexed by arrival airport where, for any arrival airport,
each column has a count of the number of King Triton’s flights that
landed at that airport. To get the count for San Diego, we need the
entry in any column for the row corresponding to San Diego. The code
.get('FLIGHT') says we’ll use the 'FLIGHT'
column, but any other column would be equivalent. To access the entry of
this column corresponding to San Diego, we have to use .loc
because we know the name of the value in the index should be
'SAN', but we don’t know the row number or integer
position.
The average score on this problem was 89%.
Consider the DataFrame san, defined below.
san = flights[(flights.get('FROM') == 'SAN') & (flights.get('TO') == 'SAN')]Which of these DataFrames must have the same number
of rows as san?
flights[(flights.get('FROM') == 'SAN') and (flights.get('TO') == 'SAN')]
flights[(flights.get('FROM') == 'SAN') | (flights.get('TO') == 'SAN')]
flights[(flights.get('FROM') == 'LAX') & (flights.get('TO') == 'SAN')]
flights[(flights.get('FROM') == 'LAX') & (flights.get('TO') == 'LAX')]
Answer:
flights[(flights.get('FROM') == 'LAX') & (flights.get('TO') == 'LAX')]
The DataFrame san contains all rows of
flights that have a departure airport of 'SAN'
and an arrival airport of 'SAN'. But as you may know, and
as you’re told in the data description, there are no flights from an
airport to itself. So san is actually an empty DataFrame
with no rows!
We just need to find which of the other DataFrames would necessarily
be empty, and we can see that
flights[(flights.get('FROM') == 'LAX') & (flights.get('TO') == 'LAX')]
will be empty for the same reason.
Note that none of the other answer choices are correct. The first
option uses the Python keyword and instead of the symbol
&, which behaves unexpectedly but does not give an
empty DataFrame. The second option will be non-empty because it will
contain all flights that have San Diego as the departure airport or
arrival airport, and we already know from the first few rows of
flight that there are some of these. The third option will
contain all the flights that King Triton has taken from
'LAX' to 'SAN'. Perhaps he’s never flown this
route, or perhaps he has. This DataFrame could be empty, but it’s not
necessarily going to be empty, as the question requires.
The average score on this problem was 70%.
We define a “route” to be a departure and arrival airport pair. For
example, all flights from 'SFO' to 'SAN' make
up the “SFO to SAN route”. This is different from the “SAN to SFO
route”.
Fill in the blanks below so that
most_frequent.get('FROM').iloc[0] and
most_frequent.get('TO').iloc[0] correspond to the departure
and destination airports of the route that King Triton has spent the
most time flying on.
most_frequent = flights.groupby(__(a)__).__(b)__
most_frequent = most_frequent.reset_index().sort_values(__(c)__)What goes in blank (a)?
Answer: ['FROM', 'TO']
We want to organize flights by route. This means we need to group by
both 'FROM' and 'TO' so any flights with the
same pair of departure and arrival airports get grouped together. To
group by multiple columns, we must use a list containing all these
column names, as in flights.groupby(['FROM', 'TO']).
The average score on this problem was 72%.
What goes in blank (b)?
count()
mean()
sum()
max()
Answer: sum()
Every .groupby command needs an aggregation function!
Since we are asked to find the route that King Triton has spent the most
time flying on, we want to total the times for all flights on a given
route.
Note that .count() would tell us how many flights King
Triton has taken on each route. That’s meaningful information, but not
what we need to address the question of which route he spent the most
time flying on.
The average score on this problem was 58%.
What goes in blank (c)?
by='HOURS', ascending=True
by='HOURS', ascending=False
by='HOURS', descending=True
by='DIST', ascending=False
Answer:
by='HOURS', ascending=False
We want to know the route that King Triton spent the most time flying
on. After we group flights by route, summing flights on the same route,
the 'HOURS' column contains the total amount of time spent
on each route. We need most_frequent.get('FROM').iloc[0]
and most_frequent.get('TO').iloc[0] to correspond with the
departure and destination airports of the route that King Triton has
spent the most time flying on. To do this, we need to sort in descending
order of time, to bring the largest time to the top of the DataFrame. So
we must sort by 'HOURS' with
ascending=False.
The average score on this problem was 94%.
Suppose we’ve run the following line of code.
counts = evs.groupby("Brand").count()What value does counts.get("Range").sum() evaluate
to?
Answer: 32
counts is a DataFrame with one row per
"Brand", since we grouped by "Brand". Since we
used the .count() aggregation method, the columns in
counts will all be the same – they will all contain the
number of rows in evs for each "Brand"
(i.e. they will all contain the distribution of "Brand").
If we sum up the values in any one of the columns in
counts, then, the result will be the total number of rows
in evs, which we know to be 32. Thus,
counts.get("Range").sum() is 32.
The average score on this problem was 56%.
What value does counts.index[3] evaluate to?
Answer: "Tesla"
Since we grouped by "Brand" to create
counts, the index of counts will be
"Brand", sorted alphabetically (this sorting happens
automatically when grouping). This means that counts.index
will be the array-like sequence
["Audi", "BMW", "Nissan", "Tesla"], and
counts.index[3] is "Tesla".
The average score on this problem was 33%.
Consider the variable is_fraud_mean, defined below.
is_fraud_mean = txn.get("is_fraud").mean()Which of the following expressions are equivalent to
is_fraud_mean? Select all that apply.
txn.groupby("is_fraud").mean()
txn.get("is_fraud").sum() / txn.shape[0]
np.count_nonzero(txn.get("is_fraud")) / txn.shape[0]
(txn.get("is_fraud") > 0.8).mean()
1 - (txn.get("is_fraud") == 0).mean()
None of the above.
Answer: B, C, D, and E.
The correct responses are B, C, D, and E. First, we must see that
txn.get("is_fraud").mean() will calculate the mean of the
"is_fraud" column, which is a float representing the
proportion of values in the "is_fraud" column that are
True. With this in mind, we can consider each option:
Option A: This operation will result in a DataFrame. We first
group by "is_fraud", creating one row for fraudulent
transactions and one row for non-fraudulent ones. We then take the mean
of each numerical column, which will determine the entries of the
DataFrame. Since this results in a DataFrame and not a float, this
answer choice cannot be correct.
Option B: Here we simply take the mean of the
"is_fraud" column using the definition of the mean as the
sum of the values divided by the nuber of values. This is equivalent to
the original.
Option C: np.count_nonzero will return the number of
nonzero values in a sequence. Since we only have True and False values
in the "is_fraud" column, and Python considers
True to be 1 and False to be 0, this means
counting the number of ones is equivalent to the sum of all the values.
So, we end up with an expression equivalent to the formula for the mean
which we saw in part B.
Option D: Recall that "is_fraud" contains Boolean
values, and that True evaluates to 1 and False
evaluates to 0. txn.get("is_fraud") > 0.8 conducts an
elementwise comparison, evaluating if each value in the column is
greater than 0.8, and returning the resulting Series of Booleans. Any
True (1) value in the column will be greater than 0.8, so
this expression will evaluate to True. Any
False (0) value will still evaluate to False,
so the values in the resulting Series will be identical to the original
column. Therefore, taking the mean of either will give the same
value.
Option E: txn.get("is_fraud") == 0 performs an
elementwise comparison, returning a series which has the value
True where "is_fraud" is False
(0), and False where "is_fraud" is
True. Therefore the mean of this Series represents the
proportion of values in the "is_fraud" column that are
False. Since every value in that column is either
False or True, the proportion of
True values is equivalent to one minus the proportion of
False values.
The average score on this problem was 69%.
Suppose we define the three variables below.
J = living_cost.get("county") == "Benton County"
K = living_cost.get("state") == "IN"
L = living_cost.get("family_type") == "1a2c"
Feel free to use these variables in your solutions to the following questions.
Fill in the blanks so that the expression below evaluates to the average yearly childcare cost for families with one adult and two children in Benton County, IN.
__(a)__.__(b)__.iloc[0]What goes in blank (a)?
What goes in blank (b)?
Answer:
living_cost[J & K & L]The first step is to query the rows in the DataFrame that meet our
specific criteria. In this case, we want the rows in the DataFrame where
the county is "Benton County", the state is
"IN", and the family has 1 adult and 2 children.
J, K, and L specify these
criteria. When used to query the living_cost DataFrame, we
are able to obtain a DataFrame with only one row, corresponding this
family type in this specific county.
The average score on this problem was 69%.
Answer:
get("avg_childcare_cost")Once we have a DataFrame that contains the row we need, we need to
use it to get the average yearly childcare cost. To do that, we get out
the "avg_childcare_cost" column and access the entry in row
0 with .iloc[0]. This works because after querying, there
is only one row, and it corresponds exactly to the families with one
adult and two children in Benton County, IN.
The average score on this problem was 57%.
Fill in the blanks so that the expression below evaluates to the number of states with a county named Benton County.
__(c)__.__(d)__ / 10What goes in blank (c)?
What goes in blank (d)?
Answer:
living_cost[J]Since we want to find how many states have a county named
"Benton County", we first want to obtain all the rows of
the DataFrame where the county is "Benton County". Variable
J specifies this condition, so we use it to query and
obtain a DataFrame with the rows in living_cost where the
county is "Benton County."
The average score on this problem was 60%.
Answer:
shape[0]Now that we have all the rows in the DataFrame where the county is
"Benton County", let’s consider how many rows it has. Each
row of this DataFrame represents a unique combination of
"state" and "family_type" for counties called
"Benton County". We know from the data description that
each of the ten family structures is present in each county. This means
that for each state with a county called "Benton County",
our DataFrame has exactly ten rows. Therefore, the number of states with
a county called "Benton County" is the total number of rows
in our DataFrame divided by ten. Therefore, we should fill in blank (d)
with .shape[0] to extract the number of rows from our
DataFrame.
The average score on this problem was 40%.
Fill in the blanks so that count_1 and
count_2 both evaluate to the number of items in
items with a "Cost" of 0.
count_1 = items.groupby(__(a)__).__(b)__().get("Item").loc[__(c)__]
count_2 = items[__(d)__].shape[0]Answer:
a: "Cost"b: countc: 0d: items.get("Cost") == 0
The average score on this problem was 81%.
Write a Python expression that evaluates to the address of the house with the most pieces of candy available (the most pieces, not the most varieties).
It’s okay if you need to write on multiple lines, but your code should represent a single expression in Python.
Answer:
treat.groupby("address").sum().sort_values(by="how_many", ascending = False).index[0]
or
treat.groupby("address").sum().sort_values(by="how_many").index[-1]
In the treat DataFrame, there are multiple rows for each
address, one for each candy they are giving out with their quantity.
Since we want the address with the most pieces of candy available, we
need to combine this information, so we start by grouping by address:
treat.groupby(“address”). Now, since we want to add the
number of candy available per address, we use the sum()
aggregate function. So now we have a DataFrame with one row per address
where there value in each column is the sum of all the values. To get
the address with the most pieces of candy available, we can simply sort
by the “how_many” column since this stores the total amount
of candy per house. Setting ascending=False means that the
address with the greatest amount of candy will be the first row. Since
the addresses are located in the index as a result of the
groupby, we can access this value by using
index[0].
Note: If you do not set ascending=False, then the
address with the most amount of candy available will be the last row
which you can access by index[-1].
The average score on this problem was 67%.
As in the last problem, we’ll continue working with the
tot DataFrame that came from merging trick
with treat. The "price" column contains the
cost in dollars of a single piece of fun-sized candy,
as a float.
In this problem, we want to use tot to calculate the
average cost per piece of Halloween candy at each
house. For example, suppose one house has 30 Twix, which cost \$0.20 each, and 20 Laffy Taffy, which cost
\$0.10 each. Then this house spent
\$8.00 on 50 pieces of candy, for an
average cost of \$0.16 per piece.
Which of the following correctly sets ac to a DataFrame
indexed by "address" with a column called
"avg_cost" that contains the average cost per piece of
Halloween candy at each address? Select all that apply.
Way 1:
ac = tot.groupby("address").sum()
ac = ac.assign(avg_cost = ac.get("price") /
                          ac.get("how_many")).get(["avg_cost"])
Way 2:
ac = tot.assign(x = tot.get("price") / tot.get("how_many"))
ac = ac.groupby("address").sum()
ac = ac.assign(avg_cost = ac.get("x").mean()).get(["avg_cost"])
Way 3:
ac = tot.assign(x = tot.get("price") / tot.get("how_many"))
ac = ac.groupby("address").sum()
ac = ac.assign(avg_cost = ac.get("x") /
                          ac.get("how_many")).get(["avg_cost"])
Way 4:
ac = tot.assign(x = tot.get("how_many") * tot.get("price"))
ac = ac.groupby("address").sum()
ac = ac.assign(avg_cost = ac.get("x").mean()).get(["avg_cost"])
Way 5:
ac = tot.assign(x = tot.get("how_many") * tot.get("price"))
ac = ac.groupby("address").sum()
ac = ac.assign(avg_cost = ac.get("x") /
                          ac.get("how_many")).get(["avg_cost"])
Way 1
Way 2
Way 3
Way 4
Way 5
Answer: Option 5
We need the average cost per piece at each house.
The correct formula would be: (total spent on candy) / (total pieces of candy)
Let’s go through each Way and assess if it is valid or not.
Way 1: When we sum the “price” column directly, we’re summing the per-piece prices, not the total spent. This gives wrong totals. For example, if a house has 30 pieces at $0.20 and 20 at $0.10, summing prices gives $0.30 instead of $8.00.
Way 2: This first calculates price/quantity for each candy type, then takes the mean of these ratios. This is mathematically incorrect for finding average cost per piece.
Way 3: Similar to Way 2, but even more problematic as it divides by quantity twice.
Way 4: Correctly calculates total spent (x = quantity * price) but then takes the mean of the totals instead of dividing by total quantity.
Way 5: This is correct because:
Using our example:
The average score on this problem was 71%.
Extra Credit
Define the variable double as follows.
double = treat.groupby("candy").count().groupby("address").count()
Now, suppose you know that
double.loc[1].get("how_many") evaluates to
5.
Which of the following is a valid interpretation of this information? Select all that apply.
There are five houses that are each giving out only one type of candy.
There are five types of candy that are each being given out by only one house.
There is only one house that is giving out five types of candy.
There is only one type of candy that is being given out by five houses.
None of these.
Answer: Option 2
Let’s approach this solution by breaking down the line of code into two intermediate steps, so that we can parse them one at a time:
intermediate_one = treat.groupby("candy").count()double = intermediate_one.groupby("address").count()Step 1:
intermediate_one = treat.groupby("candy").count()
The first of our two operations groups the treat
DataFrame by the "candy" column, and aggregates using the
.count() method. This creates an output DataFrame that is
indexed by "candy", where the values in each column
represent the number of times each candy appeared in the
treat DataFrame.
Remember, in our original DataFrame, each row represents one type of
candy being given out by one house. So, each row in
intermediate_one will contain the number of houses
giving out each candy. For example, if the values in the
columns in the row with row label Milky Way were all 3, it would mean that there are 3 houses giving out Milky Ways.
Step 2:
double = intermediate_one.groupby("address").count()
The second of our two operations groups the
intermediate_one DataFrame by the "address"
column, and aggregates using the .count() method. This
creates an output DataFrame that is indexed by "address",
where the values in each column represent the number of times that each
value in the address column appeared in the
intermediate_one DataFrame. However, these are more
difficult to interpret, so let’s break down what this means in the
context of our problem.
The values in the intermediate_one DataFrame represent
how many houses are giving out a specific type of candy (this is the
result of our first operation). So, when we group by these values, the
resulting groups will be defined by all candies that are given out by
the same number of houses. For example, if the values in the columns
with row label 5 were all 2, it would mean that there are 2 types of candy that are being given out by
5 houses. More concretely, this would
mean that the value 5 showed up 2 times in the intermediate_one
DataFrame, which means there must have been 2 candies that were being given out by 5 houses (see above).
Combining these two results, we can interpret the output of our original line of code:
double = treat.groupby("candy").count().groupby("address").count()
outputs a DataFrame where the value in each row represents the number of
different candies that are being given out by the same number of
houses.
Now, we can easily interpret this line of code:
double.loc[1].get("how_many") evaluates to
5.
This means that there are 5 different types of candies that are being given out by only 1 house. This corresponds to Option 2 and only Option 2 in our answer choices, so Option 2 is the correct answer.
The average score on this problem was 15%.
Select the correct way to fill in the blank such that the code below
evaluates to a DataFrame with a single row for each UC campus, where the
"Degrees" column contains the average number of degrees
awarded by that campus per academic year (over the past six years).
uc.groupby(______).mean() "Year"
["Campus", "Year"]
"Campus"
["Campus", "Degrees"]
"Degrees"
["Year", "Degrees"]
Answer: "Campus"
The average score on this problem was 40%.
Fill in the blank so that the expression below evaluates to the number of years (out of the past six years) in which UC San Diego awarded more than 12,000 degrees.
uc[______].shape[0]Answer:
(uc.get("Campus") == "San Diego") & (uc.get("Degrees") > 12000)
The average score on this problem was 61%.
Nintendo management sends you some information about your new job, but there seems to be an encryption puzzle blocking you from opening the file. To undo the encryption and open the file, determine the datatype of each expression below, or indicate that the expression produces an error.
smash.shape[0] / 1int
float
str
bool
DataFrame
error
Answer: float
The average score on this problem was 64%.
str(len(smash)) * 2.0int
float
str
bool
DataFrame
error
Answer: error
The average score on this problem was 63%.
smash.get("Year").iloc[0] == "1981"int
float
str
bool
DataFrame
error
Answer: bool
The average score on this problem was 71%.
smash.take([0])int
float
str
bool
DataFrame
error
Answer: DataFrame
The average score on this problem was 75%.
For diversity, we need to cut fighters from the most common
"Species". Fill in the blanks below to find the
"Species" with the most fighters (i.e. the
"Species" most represented in smash).
smash.groupby("Species").___(a)___().sort_values(by="Year").___(b)___(a): count
(b): index[-1]
The average score on this problem was 64%.
You decide to eliminate some of the fighters that have
"Sword" as their "Weapon". Select
all expressions that evaluate to the total number of such
fighters.
smash[smash.get("Weapon") == "Sword"].shape[0]
smash.get("Weapon").count("Sword")
(smash.get("Weapon") == "Sword").shape[0]
smash[smash.get("Weapon") == "Sword"].sum()
smash.groupby("Weapon").count().get("Franchise").loc["Sword"]
None of the above.
Answer: Options 1 and 5.
The average score on this problem was 73%.
Complete the expression below so that it evaluates to a DataFrame
indexed by 'category' with one column called
'price' containing the median cost of the products in each
category.
ikea.___(a)___.get(___(b)___)What goes in blank (a)?
Answer:
groupby('category').median()
The question prompt says that the resulting DataFrame should be
indexed by 'category', so this is a hint that we may want
to group by 'category'. When using groupby, we
need to specify an aggregation function, and since we’re looking for the
median cost of all products in a category, we use the
.median() aggregation function.
The average score on this problem was 90%.
What goes in blank (b)?
Answer: ['price']
The question prompt also says that the resulting DataFrame should
have just one column, the 'price' column. To keep only
certain columns in a DataFrame, we use .get, passing in a
list of columns to keep. Remember to include the square brackets,
otherwise .get will return a Series instead of a
DataFrame.
The average score on this problem was 76%.
Write one line of code below to create a DataFrame called
openers containing the artists that appeared first on stage
at a past Sun God festival. The DataFrame openers should
have all the same columns as sungod.
Answer:
openers = sungod[sungod.get('Appearance_Order')==1]
Since we want only certain rows of sungod, we need to
query. The condition to satisfy is that the
'Appearance_Order' column should have a value of 1 to
indicate that this artist performed first in a certain year’s
festival.
The average score on this problem was 84%.
What was the largest number of artists that ever performed in a single Sun God festival? Select all expressions that evaluate to the correct answer.
sungod.groupby('Appearance_Order').count().get('Year').max()
sungod.groupby('Year').count().get('Artist').max()
sungod.get('Appearance_Order').max()
sungod.groupby('Year').max().get('Year').max()
None of the above.
Answer:
sungod.groupby('Year').count().get('Artist').max(),
sungod.get('Appearance_Order').max()
Let’s go through all the answer choices.
For the first option,
sungod.groupby('Appearance_Order').count() will create a
DataFrame with one row for each unique value of
'Appearance_Order', and each column will contain the same
value, which represents the number of Sun God festivals that had at
least a certain amount of performers. For example, the first row of
sungod.groupby('Appearance_Order').count() will correspond
to an 'Appearance_Order' of 1, and each column will contain
a count of the number of Sun God festivals with at least one performer.
Since every festival has at least one performer, the largest count in
any column, including 'Year' will be in this first row. So
sungod.groupby('Appearance_Order').count().get('Year').max()
represents the total number of Sun God festivals, which is not the
quantity we’re trying to find.
For the second option, sungod.groupby('Year').count()
will create a DataFrame with one row per year, with each column
containing a count of the number of artists that performed in that
year’s festival. If we take the largest such count in any one column, we
are finding the largest number of artists that ever performed in a
single Sun God festival. Therefore,
sungod.groupby('Year').count().get('Artist').max() is
correct.
The third option works because we can find the desired quantity by
simply looking for the largest value in the
'Appearance_Order' column. For example, if the largest
number of artists to ever perform in a Sun God festival was, say, 17,
then for that year’s festival, the last artist to appear would have a
value of 17 in the 'Appearance_Order' column. There can be
no 18 anywhere in the 'Appearance_Order' column, otherwise
that would mean there was some festival with 18 performers. Therefore,
sungod.get('Appearance_Order').max() is correct.
The fourth option is not even correct Python code. The DataFrame
produced by sungod.groupby('Year').max() is indexed by
'Year' and no longer has 'Year' as a column.
So we’d get an error if we tried to access this nonexistent column, as
in sungod.groupby('Year').max().get('Year').
The average score on this problem was 78%.
What is the type of the following expression?
(survey
 .sort_values(by="Class Standing")
)
int or float
list or array
Boolean
Series
string
DataFrame
Answer: DataFrame
The method .sort_values(by="Class Standing") sorts the
survey DataFrame by the "Class Standing"
column and returns a new DataFrame (without modifying the original one).
The resulting DataFrame will be sorted by class standing in ascending
order unless specified otherwise by providing the
ascending=False argument.
The average score on this problem was 94%.
What is the type of the following expression?
(survey
 .sort_values(by="Class Standing")
 .groupby("College").count()
)
int or float
list or array
Boolean
Series
string
DataFrame
Answer: DataFrame
The method .sort_values(by="Class Standing") sorts the
survey DataFrame based on the entries in the
"Class Standing" column and produces a new DataFrame.
Following this, .groupby("College") organizes the sorted
DataFrame by grouping entries using the "College" column.
After that, the .count() aggregation method computes the
number of rows for each "College". The result is a
DataFrame whose index contains the unique values in
"College" and whose columns all contain the same values –
the number of rows in
survey.sort_values(by="Class Standing") for each
"College".
Note that if we didn’t sort before grouping – that is, if our
expression was just survey.groupby("College").count() – the
resulting DataFrame would be the same! That’s because the order of the
rows in survey does not impact the number of rows in
survey that belong to each "College".
The average score on this problem was 93%.
What is the type of the following expression?
(survey
 .sort_values(by="Class Standing")
 .groupby("College").count()
 .get("IG Followers")
)
int or float
list or array
Boolean
Series
string
DataFrame
Answer: Series
The above expression, before .get("IG Followers"), is
the same as in the previous subpart. We know that
survey.sort_values(by="Class Standing").groupby("College").count()is a DataFrame indexed by "College" with multiple
columns, each of which contain the number of rows in
survey.sort_values(by="Class Standing") for each
"College". Then, using .get("IG Followers")
extracts just the "IG Followers" column from the
aforementioned counts DataFrame, and we know that columns are stored as
Series. We know that this column exists, because
survey.sort_values(by="Class Standing").groupby("College").count()
will have the same columns as survey, minus
"College", which was moved to the index.
The average score on this problem was 92%.
What is the type of the following expression?
(survey
 .sort_values(by="Class Standing")
 .groupby("College").count()
 .get("IG Followers")
 .iloc[0]
)
int or float
list or array
Boolean
Series
string
DataFrame
Answer: int or float
In the previous subpart, we saw that
survey.sort_values(by="Class Standing").groupby("College").count().get("IG Followers")is a Series whose index contains the unique names of
"College"s and whose values are the number of rows in
survey.sort_values(by="Class Standing") for each college.
The number of rows in
survey.sort_values(by="Class Standing") for any particular
college – say, "Sixth" – is a number, and so the values in
this Series are all numbers. As such, the answer is int or float.
The average score on this problem was 91%.
What value does the following expression evaluate to? If you believe the expression errors, provide a one sentence explanation of why.
For example, if you think the expression evaluates to an int, don’t
write “int" or”the largest value in the "IG Followers"
column", write the specific int, like “23".
Hint: You have enough information to answer the problem; don’t forget to look at the data description page.
(survey
.sort_values(by="Class Standing")
.groupby("College").count()
.get("IG Followers")
.index[0]
)Answer: "ERC"
From the previous subpart, we saw that
survey
.sort_values(by="Class Standing")
.groupby("College").count()
.get("IG Followers")
is a Series, indexed by "College", whose values contain
the number of rows in
survey.sort_values(by="Class Standing") for each
"College". When we group by "College", the
resulting DataFrame (and hence, our Series) is sorted in ascending order
by "College". This means that the index of our Series is
sorted alphabetically by "College" names. Of the
"College" names mentioned in the data description
("ERC", "Marshall", "Muir",
"Revelle", "Seventh", "Sixth",
and "Warren"), the first name alphabetically is
"ERC", so using .index[0] on the above index
gives us "ERC".
The average score on this problem was 32%.
Consider again the expression from 1.5. Suppose we remove the piece
.sort_values(by="Class Standing")but keep all other parts the same. Does this change the value the expression evaluates to?
Yes, this changes the value the expression evaluates to.
No, this does not change the value the expression evaluates to.
Answer: No, this does not change the value the expression evaluates to.
We addressed this in the second subpart of the problem: “Note
that if we didn’t sort before grouping – that is, if our expression was
just survey.groupby("College").count() – the resulting
DataFrame would be the same! That’s because the order of the rows in
survey does not impact the number of rows in
survey that belong to each
"College".”
The average score on this problem was 80%.
What value does the following expression evaluate to? If you believe the expression errors, provide a one sentence explanation of why.
For example, if you think the expression evaluates to an int, don’t
write “int” or “the largest value in the "IG Followers"
column”, write the specific int, like “23”.
Hint: You have enough information to answer the problem; don’t forget to look at the data description page.
(survey
 .sort_values(by="Class Standing")
 .groupby("College").count()
 .get("IG Followers")
 .loc[0]
)Answer: The code produces an error because, after
the grouping operation, the resulting Series uses the unique college
names as indices, and there isn’t a college named 0.
In the previous few subparts, we’ve established that
survey
.sort_values(by="Class Standing")
.groupby("College").count()
.get("IG Followers")
is a Series, indexed by "College", whose values contain
the number of rows in
survey.sort_values(by="Class Standing") for each
"College".
The .loc accessor is used to extract a value from a
Series given its label, or index value. However, since the index values
in the aforementioned Series are "College" names, there is
no value whose index is 0, so this throws an error.
The average score on this problem was 54%.
Consider the following block of code.
    A = survey.shape[0]
    B = survey.groupby(["Unread Emails", "IG Followers"]).count().shape[0]
Suppose the expression A == B evaluates to
True. Given this fact, what can we conclude?
There are no two students in the class with the same number of unread emails.
There are no two students in the class with the same number of Instagram followers.
There are no two students in the class with the same number of Instagram followers, and there are no two students in the class with the same number of unread emails.
There are no two students in the class with both the same number of unread emails and the same number of Instagram followers.
Answer: There are no two students in the class with both the same number of unread emails and the same number of Instagram followers.
The DataFrame
survey.groupby(["Unread Emails", "IG Followers"]).count()
will have one row for every unique combination of
"Unread Emails" and "IG Followers". If two
students had the same number of "Unread Emails" and
"IG Followers", they would be grouped together, resulting
in fewer groups than the total number of students. But since
A == B, it indicates that there are as many unique
combinations of these two columns as there are rows in the
survey DataFrame. Thus, no two students share the same
combination of "Unread Emails" and
"IG Followers".
Note that if student X has 2 "Unread Emails" and 5
"IG Followers", student Y has 2
"Unread Emails" and 3 "IG Followers", and
student Z has 3 "Unread Emails" and 5
"IG Followers", they all have different combinations of
"Unread Emails" and "IG Followers", meaning
that they’d all be represented by different rows in
survey.groupby(["Unread Emails", "IG Followers"]).count().
This is despite the fact that some of their numbers of
"Unread Emails" and "IG Followers" are not
unique.
The average score on this problem was 72%.
We’d like to find the mean number of Instagram followers of all students in DSC 10. One correct way to do so is given below.
mean_1 = survey.get("IG Followers").mean()Another two possible ways to do this are given below.
    # Possible method 1.
    mean_2 = survey.groupby("Section").mean().get("IG Followers").mean()

    # Possible method 2.
    X = survey.groupby("Section").sum().get("IG Followers").sum()
    Y = survey.groupby("Section").count().get("IG Followers").sum()
    mean_3 = X / Y
Is mean_2 equal to mean_1?
Yes.
Yes, if both sections have the same number of students, otherwise maybe.
Yes, if both sections have the same number of students, otherwise no.
No.
Is mean_3 equal to mean_1?
Yes.
Yes, if both sections have the same number of students, otherwise maybe.
Yes, if both sections have the same number of students, otherwise no.
No.
Answer:
Is mean_2 is equal to mean_1? Yes,
if both sections have the same number of students, otherwise
maybe.
mean_2 is the “mean of means” – it finds the mean number
of "IG Followers" for each section, then finds the mean of
those two numbers. This is not in general to the overall mean, because
it doesn’t consider the fact that Section A may have more students than
Section B (or vice versa); if this is the case, then Section A needs to
be weighted more heavily in the calculation of the overall mean.
Let’s look at a few examples to illustrate our point. - Suppose
Section A has 2 students who both have 10 followers, and Section B has 1
student who has 5 followers. The overall mean number of followers is
\frac{10 + 10 + 5}{3} = 8.33.., while
the mean of the means is \frac{10 + 5}{2} =
7.5. These are not the same number, so mean_2 is not
always equal to mean_1. We can rule out “Yes” as an option.
- Suppose Section A has 2 students where one has 5 followers and one has
7, and Section B has 2 students where one has 3 followers and one has 15
followers. Then, the overall mean is \frac{5 +
7 + 3 + 13}{4} = \frac{28}{4} = 7, while the mean of the means is
\frac{\frac{5+7}{2} + \frac{3 + 13}{2}}{2} =
\frac{6 + 8}{2} = 7. If you experiment (or even write out a full
proof), you’ll note that as long as Sections A and B have the same
number of students, the overall mean number of followers across their
two sections is equal to the mean of their section-specific mean numbers
of followers. We can rule out “No” as an option. - Suppose Section A has
2 students who both have 10 followers, and Section B has 3 students who
both have 10 followers. Then, the overall mean is 10, and so is the mean
of means. So, it’s possible for there to be a different number of
students in Sections A and B and for mean_2 to be equal to
mean_1. It’s not always, true, though, which is why the
answer is “Yes, if both sections have the same number of students,
otherwise maybe” and we can rule out the “otherwise no” case.
The average score on this problem was 15%.
Is mean_3 is equal to mean_1?
Yes.
Let’s break down the calculations:
X:
survey.groupby("Section").sum().get("IG Followers")
calculates the total number of followers for each section separately.
The subsequent .sum() then adds these totals together,
providing the total number of followers in the entire class.Y:
survey.groupby("Section").count().get("IG Followers")
counts the number of students in each section. The subsequent
.sum() then aggregates these counts, giving the total
number of students in the entire class.Then, mean_3 = X / Y divides the total number of
Instagram followers by the total number of students to get the overall
average number of followers per student for the entire dataset. This is
precisely how mean_1 is calculated. Hence,
mean_3 and mean_1 will always be equal, so the
answer is “Yes.”
The average score on this problem was 58%.
Imagine a DataFrame constructed from apts called
bedrooms, which has one row for each bedroom in an
apartment in apts. More specifically, a one bedroom
apartment in apts will appear as one row in
bedrooms, a two bedroom apartment in apts will
appear as two rows in bedrooms, and a three bedroom
apartment in apts will appear as three rows in
bedrooms. Studio apartments will not appear in
bedrooms at all.
The "Apartment ID" column of bedrooms
contains the "Apartment ID" of the apartment in
apts. Notice that this is not the index of
bedrooms since these values are no longer unique. The
"Cost" column of bedrooms contains the rent of
the apartment divided by the number of bedrooms. All rows of
bedrooms with a shared "Apartment ID" should
therefore have the same value in the "Cost" column.
Recall that apts has 800 rows. How many rows does
bedrooms have?
800
More than 800.
Less than 800.
Not enough information.
Answer: Not enough information.
It is entirely possible that bedrooms has more or less
than 800 rows; we don’t have enough info to tell.
If most of the 800 rows in apts are studio apartments,
most rows in apts will not have corresponding rows in
bedrooms (studio apartments are not reflected in
bedrooms). This would lower the total number of rows in
bedrooms to less than 800.
If most of the 800 rows in apts are three-bedroom
apartments, most rows in apts will each have three
corresponding rows in bedrooms. This would increase the
total number of rows in bedrooms to more than 800.
The average score on this problem was 68%.
Suppose no_studio is defined as follows. (Remember, we
previously converted the "Beds" column to integers.)
no_studio = apts[apts.get("Bed") != 0]Which of the following statements evaluate to the same value as the expression below?
bedrooms.get("Cost").mean()Select all that apply.
no_studio.get("Rent").mean()
no_studio.get("Rent").sum() / apts.get("Bed").sum()
(no_studio.get("Rent") / no_studio.get("Bed")).mean()
(no_studio.get("Rent") / no_studio.get("Bed").sum()).sum()
no_studio.get("Rent").mean() / no_studio.get("Bed").mean()
None of these.
Answer: Options 2, 4, and 5.
Let’s refer to bedrooms.get("Cost").mean() as “the
bedroom code” for this solution.
Option 1 is incorrect. Option 1 takes the mean of all non-studio
apartment rents in apts. This value is significantly larger
than what is produced by the bedroom code (average value of the “Cost”
column in bedrooms), since all “Cost” values in
bedrooms are less than or equal to their corresponding
“Rent” values in apts. So, these two expressions cannot be
equal.
Option 2 is correct. We can view the bedroom code as the same as
summing all of the values in the “Cost” column of bedrooms
and dividing by the total number of rows of bedrooms. This
is a fraction; we can make some clever substitutions in this fraction to
show it is the same as the code for Option 2:
\dfrac{\text{sum of ``Cost" in bedrooms}}{\# \text{ of rows in bedrooms}} \to \dfrac{\text{sum of ``Rent" in no}\_\text{studio}}{\# \text{ of rows in bedrooms}} \to \dfrac{\text{sum of ``Rent" in no}\_\text{studio}}{\text{sum of ``Bed" in apts}}
Option 3 is incorrect. The first part of Option 3,
no_studio.get("Rent") / no_studio.get("Bed"), produces a
Series that contains all the values in the “Cost” column of
no_studio, except without duplicated rows for multi-bed
apartments. Taking the .mean() of this look-alike Series is
not the same as taking the .mean() of the bedroom code, so
these two expressions cannot be equal.
Option 4 is correct. We can show the bedroom code is equivalent to the code in Option 4 as follows:
\dfrac{\text{sum of ``Cost" in bedrooms}}{\# \text{ of rows in bedrooms}} \to \dots \to \dfrac{\text{sum of ``Rent" in no}\_\text{studio}}{\text{sum of ``Bed" in apts}} \to
\dfrac{\text{sum of ``Rent" in no}\_\text{studio}}{\text{sum of ``Bed" in no}\_\text{studio}} \to \text{sum} \left( \dfrac{\text{each entry in ``Rent" in no}\_\text{studio}}{\text{sum of ``Bed" in no}\_\text{studio}} \right)
Option 5 is correct. We can show the bedroom code is equivalent to the code in Option 5 as follows:
\dfrac{\text{sum of ``Cost" in bedrooms}}{\# \text{ of rows in bedrooms}} \to \dots \to \dfrac{\text{sum of ``Rent" in no}\_\text{studio}}{\text{sum of ``Bed" in no}\_\text{studio}} \to
\dfrac{\left(\dfrac{\text{sum of ``Rent" in no}\_\text{studio}}{\# \text{ of rows in no}\_\text{studio}}\right)}{\left(\dfrac{\text{sum of ``Bed" in no}\_\text{studio}}{\# \text{ of rows in no}\_\text{studio}}\right)} \to \dfrac{\text{mean of ``Rent" in no}\_\text{studio}}{\text{mean of ``Bed" in no}\_\text{studio}}
The average score on this problem was 53%.
Write a Python expression that evaluates to a DataFrame of only your
contacts whose phone numbers end in "6789".
Note: Do not use slicing, if you know what that is. You must use methods from this course.
Answer:
contacts[contacts.get("Phone").str.contains("6789")] or
contacts[contacts.get("Phone").str.contains("-6789")]
contacts.get("Phone"): retrieves the
"Phone" column from the contacts DataFrame as a
Series..str.contains("6789"): applies a string method that
checks for the presence of the substring "6789" in each
phone number, which could only present in the end of the phone number.
It returns a Boolean Series indicating True for phone numbers containing
this substring.contacts[...]: retrieve all rows where the condition is
True.
The average score on this problem was 63%.
Write an expression that evaluates to the number of art pieces made in 1950 that cost less than $10,000.
Answer:
art[(art.get("year") == 1950) & (art.get("price") < 10000)].shape[0]
The average score on this problem was 72%.
Which country has the highest "Reciprocal Tariff"? Write
one line of code that evaluates to the name of this country.
Answer:
tariffs.sort_values(by="Reciprocal Tariff", ascending=False).get("Country").iloc[0]
or
tariffs.set_index("Country").sort_values(by="Reciprocal Tariff", ascending=False).index[0]
To find the country with the highest “Reciprocal Tariff”, we need to
first sort tariffs by the "Reciprocal Tariff"
column in descending order:
tariffs.sort_values(by="Reciprocal Tariff", ascending=False).
After sorting in descending order, we know that the country with the
highest reciprocal tariff will be in the first row. Then, to get the
name of this country, we select the "Country" column using
.get("Country"). This gives us a Series of countries in
order of descending reciprocal tariffs, and we can access the first
value in this Series by using .iloc[0]. Note that if we
sort in ascending order instead, we can use .iloc[-1] to
access the last value in the Series.
Alternatively, since each country appears only once in
tariffs, we can start by setting the "Country"
column as the index: tariffs.set_index("Country"). Then, we
sort the resulting DataFrame by the "Reciprocal Tariff"
column in descending order, as explained above. Since the country names
are now in the index, the first row of this sorted DataFrame will have
the country with the highest reciprocal tariff as its index value, which
we can access by using .index[0]. Note that if we sort in
ascending order instead, we can use .index[-1] to access
the last value in the index.
The average score on this problem was 71%.
How many countries have a "Reciprocal Tariff" above
30\%? Write one line of code that
evaluates to the number of such countries.
Answer:
tariffs[tariffs.get("Reciprocal Tariff")>30].shape[0]
The average score on this problem was 89%.
Fill in the blanks so the expression below evaluates to the name of the chest that contains the most distinct items.
    (items.groupby(___(a)___).___(b)___
.sort_values(by="Quantity", ascending=___(c)___).___(d)___)Answer:
"Chest"count()Falseindex[0]The average score on this problem was 89%.
The average score on this problem was 39%.
The average score on this problem was 86%.
The average score on this problem was 67%.
Steve wants to build a village where each house is built using a
different "Item" from the
"Materials" chest (e.g., a cobblestone house, a wood house,
a brick house, etc). Assuming that each house requires at least 416
blocks of a single material, fill in the blanks so that the expression
below evaluates to the number of houses that Steve’s
village will have.
items[(___(a)___) & (___(b)___)].___(c)___Answer:
items.get("Chest") == "Materials"items.get("Quantity") >= 416shape[0]Note that answer (a) and (b) may be swapped.
The average score on this problem was 71%.
The average score on this problem was 71%.
The average score on this problem was 27%.
Which of the following expressions evaluates to the number of
"Emerald"s in Steve’s chests? Select all that apply.
items.get("Quantity").loc["Emerald"]
(items[items.get("Item") == "Emerald"].sort_values(by="Quantity").loc["Emerald"])
items.sort_values(by="Quantity").get("Quantity").iloc[0]
items[items.index == "Emerald"].get("Quantity").iloc[0]
None of the above.
Answer:
Option 1 and Option 4
The average score on this problem was 78%.
The following code computes the breed of the cheapest toy dog.
df[__(a)__].__(b)__.__(c)__Fill in part (a).
Answer: df.get('kind') == 'toy'
To find the cheapest toy dog, we can start by narrowing down our
dataframe to only include dogs that are of kind toy. We do this by
constructing the following boolean condition:
df.get('kind') == 'toy', which will check whether a dog is
of kind toy (i.e. whether or not a given row’s 'kind' value
is equal to 'toy'). As a result,
df[df.get('kind') == 'toy'] will retrieve all rows for
which the 'kind' column is equal to 'toy'.
The average score on this problem was 91%.
Fill in part (b).
Answer: .sort_values('price')
Next, we can sort the resulting dataframe by price, which will make
the minimum price (i.e. the cheapest toy dog) easily accessible to us
later on. To sort the dataframe, simply use .sort_values(),
with parameter 'price' as follows:
.sort_values('price')
The average score on this problem was 86%.
Which of the following can fill in blank (c)? Select all that apply.
loc[0]
iloc[0]
index[0]
min()
Answer: index[0]
loc[0]: loc retrieves an element by the
row label, which in this case is by 'breed', not by index
value. Furthermore, loc actually returns the entire row,
which is not what we are looking for. (Note that we are trying to find
the singular 'breed' of the cheapest toy dog.)iloc[0]: While iloc does retrieve elements
by index position, iloc actually returns the entire row,
which is not what we are looking for.index[0]: Note that since 'breed' is the
index column of our dataframe, and since we have already filtered and
sorted the dataframe, simply taking the 'breed' at index 0,
or index[0] will return the 'breed' of the
cheapest toy dog.min(): min() is a method used to find the
smallest value on a series not a dataframe.
The average score on this problem was 81%.
The following code computes an array containing the unique kinds of dogs that are heavier than 20 kg or taller than 40 cm on average.
foo = df.__(a)__.__(b)__
np.array(foo[__(c)__].__d__)Fill in blank (a).
Answer: groupby('kind')
We start this problem by grouping the dataframe by
'kind' since we’re only interested in whether each unique
'kind' of dog fits some sort of constraint. We don’t quite
perform querying yet since we need to group the DataFrame first. In
other words, we first need to group the DataFrame into each
'kind' before we could apply any sort of boolean
conditionals.
The average score on this problem was 97%.
Fill in blank (b).
Answer: .mean()
After we do .groupby('kind'), we need to apply
.mean() since the problem asks if each unique
'kind' of dog satisfies certain constraints on
average. .mean() calculates the average of each
column of each group which is what we want.
The average score on this problem was 94%.
Fill in blank (c).
Answer:
(foo.get('weight') > 20) | (foo.get('height') > 40)
Once we have grouped the dogs by 'kind' and have
calculated the average stats of each kind of dog, we can do some
querying with two conditionals: foo.get('weight') > 20
gets the kinds of dogs that are heavier than 20 kg on average and
foo.get('height') > 40 gets the kinds of dogs that are
taller than 40 cm on average. We combine these two conditions with the
| operator since we want the kind of dogs that satisfy
either condition.
The average score on this problem was 93%.
Which of the following should fill in blank (d)?
.index
.unique()
.get('kind')
.get(['kind'])
Answer: .index
Note that earlier, we did groupby('kind'), which
automatically sets each unique 'kind' as the index. Since
this is what we want anyways, simply doing .index will give
us all the kinds of dogs that satisfy the given conditions.
The average score on this problem was 94%.
Let’s say that right after blank (b), we added
reset_index(). Now, which of the following should fill in
blank (d)?
.index
.unique()
.get('kind')
.get(['kind'])
Answer: .get('kind')
Now that we have reset the index of the dataframe,
'kind' is once again its own column so we could simply do
.get('kind').
The average score on this problem was 100%.
Fill in the blanks so that the expression below evaluates to the proportion of stages won by the country with the most stage wins.
stages.groupby(__(i)__).__(ii)__.get("Type").__(iii)__ / stages.shape[0]Answer:
(i): "Winner Country"
To calculate the number of stages won by each country, we need to group
the data by the Winner Country. This will allow us to
compute the counts for each group.
(ii): count()
Once the data is grouped, we use the .count() method to
calculate the number of stages won by each country.
(iii): max()
Finds the maximum number of stages won by a single country. Finally, we
divide the maximum stage wins by the total number of stages
(stages.shape[0]) to calculate the proportion of stages won
by the top country.
The average score on this problem was 90%.
The distance of a stage alone does not encapsulate its difficulty, as riders feel more tired as the tour goes on. Because of this, we want to consider “real distance” a measurement of the length of a stage that takes into account how far into the tour the riders are. The “real distance” is calculated with the following process:
Add one to the stage number.
Take the square root of the result of (i).
Multiply the result of (ii) by the raw distance of the stage.
Complete the implementation of the function
real_distance, which takes in stages (a
DataFrame), stage (a string, the name of the column
containing stage numbers), and distance (a string, the name
of the column containing stage distances). real_distance
returns a Series containing all of the “real distances” of the stages,
as calculated above.
    def real_distance(stages, stage, distance):
________Answer:
return stages.get(distance) * np.sqrt(stages.get(stage) + 1)
(i): First, We need to add one to the stage
number. The stage parameter specifies the name of the
column containing the stage numbers. stages.get(stage)
retrieves this column as a Series, and we can directly add 1 to each
element in the series by stages.get(stage) + 1
(ii): Then, to take the square root of the
result of (i), we can use
np.sqrt(stages.get(stage) + 1)
(iii): Finally, we want to multiply the result
of (ii) by the raw distance of the stage. The distance
parameter specifies the name of the column containing the raw distances
of each stage. stages.get(distance) retrieves this column
as a pandas Series, and we can directly multiply it by
np.sqrt(stages.get(stage) + 1).
The average score on this problem was 89%.
Sometimes, stages are repeated in different editions of the Tour de
France, meaning that there are some pairs of "Origin" and
"Destination" that appear more than once in
stages. Fill in the blanks so that the expression below
evaluates how often the most common "Origin" and
"Destination" pair in the stages DataFrame
appears.
stages.groupby(__(i)__).__(ii)__.sort_values(by = "Date").get("Type").iloc[__(iii)__]Answer:
(i):
["Origin", "Destination"]
To analyze the frequency of stages with the same origin and destination,
we need to group the data by the columns
["Origin", "Destination"]. This groups the stages into
unique pairs of origin and destination.
(ii): count()
After grouping, we apply the .count() method to calculate
how many times each pair of ["Origin", "Destination"]
appears in the dataset. The result is the frequency of each
pair.
(iii): -1
After obtaining the frequencies, we sort the resulting groups by their
counts in ascending order (this is the default behavior of
.sort_values()). The most common pair will then be the last
entry in the sorted result. Using .get("Type") extracts the
series of counts, and .iloc[-1] retrieves the count of the
most common pair, which is at the last position of the sorted
series.
The average score on this problem was 84%.
Fill in the blanks so that the value of mystery_three is
the "Destination" of the longest stage before Stage 12.
    mystery = stages[stages.get(__(i)__) < 12]
    mystery_two = mystery.sort_values(by = "Distance", ascending = __(ii)__)
mystery_three = mystery_two.get(__(iii)__).iloc[-1]Answer:
(i): "Stage"
To filter the DataFrame to include only rows corresponding to stages
before Stage 12, we use the "Stage" column. The condition
stages.get("Stage") < 12 creates a boolean mask that
selects only the rows where the stage number is less than 12.
(ii): True
To find the longest stage, the rows need to be sorted by the
"Distance" column. Setting ascending=True
ensures that shorter stages come first and the longest stage appears
last in the sorted DataFrame.
(iii): "Destination"
After sorting, we want to retrieve the "Destination" of the
longest stage. Using .get("Destination") retrieves the
"Destination" column, and .iloc[-1] accesses
the last row in the sorted DataFrame, corresponding to the longest stage
before Stage 12.
The average score on this problem was 92%.
Fill in the blanks so that the expression below evaluates to the
region in the "Region" column that comes first
alphabetically.
kart.groupby(___(a)___).count().index.___(b)___What goes in (a)?
"Ranking"
"Team"
"Division"
"Region"
What goes in (b)?
"max()"
"min()"
"len()"
"split()"
Answer:
"Region""min()"In order to curate a unique list of all the regions in the DataFrame,
we want to groupby “Region". Using
count() on this will count the number of observations for
each region as a row in the DataFrame which does not really matter here
since we just wanted the unique regions. .index will
retrieve the list of all the unique regions. In order to get the first
alphabetically, we can use min().
The average score on this problem was 100%.
The average score on this problem was 81%.
Fill in the blanks so that the expression below evaluates to the
"University" of the lowest scoring Division 2 team over the
whole season.
kart[__(a)__].__(b)__(__(c)__).get("University").iloc[0]Answer:
kart.get("Division") == "Division 2"sort values"Total Points" or
by="Total Points"First we want to filter the DataFrame for only the Division 2 teams
using kart.get("Division") == "Division 2".
Since we are interested in the lowest scoring team in this division,
we want to use sort_values on the
"Total Points" column giving
sort_values(by= “Total Points”). Since we are retrieving
.iloc[0], i.e. the top row of the DataFrame, we do not have
to specify the order of ranking since the default behavior of
sort_values is ascending.
The average score on this problem was 74%.
The average score on this problem was 90%.
The average score on this problem was 86%.
Suppose df is a DataFrame and b is any
boolean array whose length is the same as the number of rows of
df.
True or False: For any such boolean array b,
df[b].shape[0] is less than or equal to
df.shape[0].
True
False
Answer: True
The brackets in df[b] perform a query, or filter, to
keep only the rows of df for which b has a
True entry. Typically, b will come from some
condition, such as the entry in a certain column of df
equaling a certain value. Regardless, df[b] contains a
subset of the rows of df, and .shape[0] counts
the number of rows, so df[b].shape[0] must be less than or
equal to df.shape[0].
The average score on this problem was 86%.
You are given a DataFrame called books that contains
columns 'author' (string), 'title' (string),
'num_chapters' (int), and 'publication_year'
(int).
Suppose that after doing books.groupby('Author').max(),
one row says
| author | title | num_chapters | publication_year |
|---|---|---|---|
| Charles Dickens | Oliver Twist | 53 | 1838 |
Based on this data, can you conclude that Charles Dickens is the alphabetically last of all author names in this dataset?
Yes
No
Answer: No
When we group by 'Author', all books by the same author
get aggregated together into a single row. The aggregation function is
applied separately to each other column besides the column we’re
grouping by. Since we’re grouping by 'Author' here, the
'Author' column never has the max() function
applied to it. Instead, each unique value in the 'Author'
column becomes a value in the index of the grouped DataFrame. We are
told that the Charles Dickens row is just one row of the output, but we
don’t know anything about the other rows of the output, or the other
authors. We can’t say anything about where Charles Dickens falls when
authors are ordered alphabetically (but it’s probably not last!)
The average score on this problem was 94%.
Based on this data, can you conclude that Charles Dickens wrote Oliver Twist?
Yes
No
Answer: Yes
Grouping by 'Author' collapses all books written by the
same author into a single row. Since we’re applying the
max() function to aggregate these books, we can conclude
that Oliver Twist is alphabetically last among all books in the
books DataFrame written by Charles Dickens. So Charles
Dickens did write Oliver Twist based on this data.
The average score on this problem was 95%.
Based on this data, can you conclude that Oliver Twist has 53 chapters?
Yes
No
Answer: No
The key to this problem is that groupby applies the
aggregation function, max() in this case, independently to
each column. The output should be interpreted as follows:
books written by Charles Dickens,
Oliver Twist is the title that is alphabetically last.books written by Charles Dickens, 53
is the greatest number of chapters.books written by Charles Dickens,
1838 is the latest year of publication.However, the book titled Oliver Twist, the book with 53 chapters, and the book published in 1838 are not necessarily all the same book. We cannot conclude, based on this data, that Oliver Twist has 53 chapters.
The average score on this problem was 74%.
Based on this data, can you conclude that Charles Dickens wrote a book with 53 chapters that was published in 1838?
Yes
No
Answer: No
As explained in the previous question, the max()
function is applied separately to each column, so the book written by
Charles Dickens with 53 chapters may not be the same book as the book
written by Charles Dickens published in 1838.
The average score on this problem was 73%.
Below, identify the data type of the result of each of the following expressions, or select “error” if you believe the expression results in an error.
sky.sort_values('height')int or float
Boolean
string
array
Series
DataFrame
error
Answer: DataFrame
sky is a DataFrame. All the sort_values
method does is change the order of the rows in the Series/DataFrame it
is called on, it does not change the data structure. As such,
sky.sort_values('height') is also a DataFrame.
The average score on this problem was 87%.
sky.sort_values('height').get('material').loc[0]int or float
Boolean
string
array
Series
DataFrame
error
Answer: error
sky.sort_values('height') is a DataFrame, and
sky.sort_values('height').get('material') is a Series
corresponding to the 'material' column, sorted by
'height' in increasing order. So far, there are no
errors.
Remember, the .loc accessor is used to access
elements in a Series based on their index.
sky.sort_values('height').get('material').loc[0] is asking
for the element in the
sky.sort_values('height').get('material') Series with index
0. However, the index of sky is made up of building names.
Since there is no building named 0, .loc[0]
causes an error.
The average score on this problem was 79%.
sky.sort_values('height').get('material').iloc[0]int or float
Boolean
string
array
Series
DataFrame
error
Answer: string
As we mentioned above,
sky.sort_values('height').get('material') is a Series
containing values from the 'material' column (but sorted).
Remember, there is no element in this Series with an index of 0, so
sky.sort_values('height').get('material').loc[0] errors.
However, .iloc[0] works differently than
.loc[0]; .iloc[0] will give us the first
element in a Series (independent of what’s in the index). So,
sky.sort_values('height').get('material').iloc[0] gives us
back a value from the 'material' column, which is made up
of strings, so it gives us a string. (Specifically, it gives us the
'material' type of the skyscraper with the smallest
'height'.)
The average score on this problem was 89%.
sky.get('city').apply(len)int or float
Boolean
string
array
Series
DataFrame
error
Answer: Series
The .apply method takes in a function and evaluates that
function on every element in a Series. Here,
sky.get('city').apply(len) is using the function
len on every element in the Series
sky.get('city'). The result is also a Series, containing
the lengths of the names of each 'city'.
The average score on this problem was 79%.
sky.get('city').apply(max)int or float
Boolean
string
array
Series
DataFrame
error
Answer: Series
This is a tricky problem!
The function that apply takes in must work on individual
elements in a Series, i.e. it must work with just a single argument. We
saw this in the above subpart, where
sky.get('city').apply(len) applied len on each
'city' name.
Here, we are trying to apply the max function on each
'city' name. The max of a single item does not
work in Python, because taking the max requires comparing
two or more elements. Try it out - in a notebook, run the expression
max(5), and you’ll see an error. So, if we tried to use
.apply(max) on a Series of numbers, we’d run into an
error.
However, we are using .apply(max) on a
Series of strings, and it turns out that Python does
allow us to take the max of a string! The max
of a string in Python is defined as the last character in the string
alphabetically, so max('hello') evaluates to
'o'. This means that
sky.get('city').apply(max) does actually run without error;
it evaluates to a Series containing the last element in the name of each
'city'.
(This subpart was trickier than we intended – we ended up giving credit to both “error” and “Series”.)
The average score on this problem was 89%.
sky.get('floors').max()int or float
Boolean
string
array
Series
DataFrame
error
Answer: int or float
The Series sky.get('floors') is made up of integers, and
sky.get('floors').max() evaluates to the largest number in
the Series, which is also an integer.
The average score on this problem was 91%.
sky.groupby('material').max()int or float
Boolean
string
array
Series
DataFrame
error
Answer: DataFrame
When grouping and using an aggregation method, the result is always a
DataFrame. The DataFrame sky.groupby('material').max()
contains all of the columns in sky, minus
'material', which has been moved to the index. It contains
one row for each unique 'material'.
Note that no columns were “dropped”, as may happen when using
.mean(), because .max() can work on Series’ of
any type. You can take the max of strings, while you cannot take the
mean of strings.
The average score on this problem was 78%.
sky.index[0]int or float
Boolean
string
array
Series
DataFrame
error
Answer: string
sky.index contains the values
'Bayard-Condict Building',
'The Yacht Club at Portofino',
'City Investing Building', etc. sky.index[0]
is then 'Bayard-Condict Building', which is a string.
The average score on this problem was 91%.
In this question, we’ll write code to learn more about the skyscrapers in the beautiful city of San Diego. (Unrelated fun fact – since the San Diego Airport is so close to downtown, buildings in downtown San Diego legally cannot be taller than 152 meters.)
Below, fill in the blank to create a DataFrame, named
san_tall, consisting of just the skyscrapers in San Diego
that are over 100 meters tall.
condition = ______
san_tall = sky[(sky.get('city') == 'San Diego') & condition]
What goes in the blank?
Answer: sky.get('height') > 100
We need to query for all of the skyscrapers that satisfy two
conditions – the 'city' must be 'San Diego'
and the 'height' must be above 100. The first condition was
already implemented for us, so we just need to construct a Boolean
Series that implements the second condition.
Here, we want all of the rows where 'height' is above
100, so we get the 'height' column and compare
it to 100 like so: sky.get('height') > 100.
The average score on this problem was 95%.
Suppose san_tall from the previous part was created
correctly. Fill in the blanks so that height_many_floors
evaluates to the height (in meters) of the skyscraper
with the most floors, amongst all skyscrapers in San
Diego that are over 100 meters tall.
height_many_floors = san_tall.______.iloc[0]What goes in the blank?
Answer:
sort_values('floors', ascending=False).get('height')
The end of the line given to us is .iloc[0]. We know
that .iloc[0] extracts the first element in whatever Series
it is called on, so what comes before .iloc[0] must be a
Series where the first element is the 'height' of the
skyscraper with the most floors, among all skyscrapers in San Diego that
are over 100 meters tall. The DataFrame we are working with,
san_tall, already only has skyscrapers in San Diego that
are over 100 meters tall.
This means that in the blank, all we need to do is:
'floors' in decreasing order (so
that the first row is the skyscraper with the most
'floors').'height' column.As such, a complete answer is
height_many_floors = san_tall.sort_values('floors', ascending=False).get('height').iloc[0].
The average score on this problem was 74%.
height_many_floors, the value you computed in the
previous part (2.2) was a number.
True or False: Assuming that the DataFrame
san_tall contains all skyscrapers in San Diego,
height_many_floors is the height (in meters) of the
tallest skyscraper in San Diego.
True
False
Answer: False
height_many_floors is the height of the skyscraper with
the most 'floors'. However, this is not necessarily the
tallest skyscraper (i.e. the skyscraper with the largest
'height')! Consider the following scenario:
height_many_floors would be 100, but it is not the
'height' of the taller building.
The average score on this problem was 84%.
You are unsure whether it would make sense to use
"BGG Rank" as the index of the games
DataFrame, because you are unsure whether this column has duplicate
values. Perhaps, for example, two games are tied and both have a rank of
6.
Select all of the expressions below that evaluate to True when the
"BGG Rank" column could be used as the index (no
duplicates), and False when it could not be used as the index
(duplicates). In other words, these are the expressions that can be used
to detect the presence of duplicate values.
(games.get("BGG Rank") - np.arange(games.shape[0])).max() == 1
games.groupby("BGG Rank").count().get("Name").max() == 1
games.shape[0] - len(np.unique(games.get("BGG Rank"))) == 0
games.get("BGG Rank").max() - games.shape[0] == 0
Note: We will not set the index of
games, instead we’ll leave it with the default index.
Answer: Options 2 and 3
Option 2:
games.groupby(“BGG Rank”).count() gets all of the unique
“BGG Rank”’s and puts them into the index. Then by using
the aggregate function .count() we are able to turn all the
remaining columns into the number of times each “BGG Rank”
appears. Since all of the columns are the same we just need to get one
of them to access the counts. In this case we get the column “Name” by
doing .get(“Name”). Finally, when we do
.max() == 1 we are checking to see if the maximum count for
the number of unique “BGG Rank”’s is one, which would mean
there are no duplicates.
Option 3: Let’s work from the inside out for this
line of code: len(np.unique(games.get(“BGG Rank”))). Like
all the others we are getting a Series of “BGG Rank”.
np.unique() gives us an array with unique elements inside
of the Series. When we do len() we are figuring out how
many unique elements there are inside of “BGG Rank”. Recall
games.shape[0] gets us the number of rows in
games. This means that we are trying to see if the number
of rows is the same as the number of unique elements inside of
“BGG Rank”, and if they are then that means they are all
unique and should equal 0.
Option 1: games.get(“BGG Rank”) will
get you a Series of the “BGG Rank” column.
np.arange(games.shape[0]) will create a numpy array that
will go from zero to games.shape[0], which is the number of
rows in the games DataFrame. So it would look something
like: arr([0, 1, 2, . . ., n]), where n is the
number of rows in games. By doing:
games.get(“BGG Rank”) - np.arange(games.shape[0]) one is
decreasing each rank by an increasing factor of one each time. This
essentially gives a Series of numbers, but it doesn’t actually have
anything to do with uniqueness. We are simply finding if the difference
between “BGG Rank” and the numpy array leads to a maximum
of 1. So although the code works it does not tell us if there are
duplicates.
Option 4: games.get(“BGG Rank”).max()
will give us the maximum element inside of “BGG Rank”.
Note, games.shape[0] gets us the number of rows in
games. We should never make assumptions about what is
inside of “BGG Rank”. This means we don’t know if the
values line up nicely like: 1, 2, 3, . . . games.shape[0],
so the maximum element could be unique, but be bigger than
games.shape[0]. Knowing this, when we do the whole line for
Option 4 it is not guaranteed to be zero when “BGG Rank” is
unique or not, so it does not detect duplicates.
The average score on this problem was 76%.
The DataFrame amelia was created by the code below, and
is shown in its entirety.
amelia = (storms[(storms.get("Name") == "AMELIA") &
         (storms.get("Year") == 1978)]
         .get(["Year", "Month", "Day", "Time",
         "Status", "Latitude", "Longitude"]))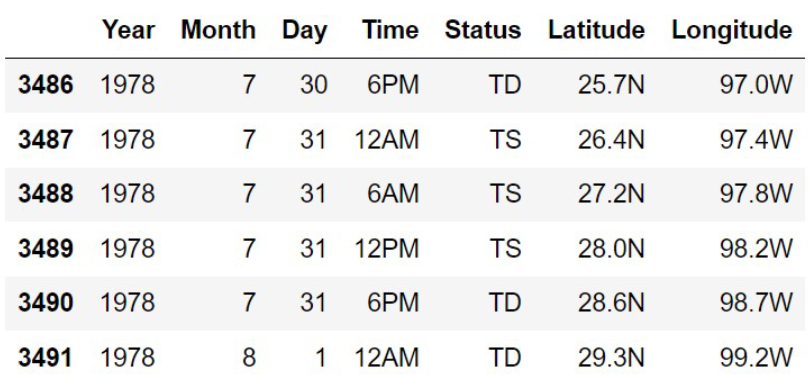
Use the space provided to show the DataFrame that results from
amelia.groupby("Status").max()The column labels should go in the top row, and the row labels (index) should go in the leftmost row. You may not need to use all the rows and columns provided.
Answer:
| Status | Year | Month | Day | Time | Latitude | Longtitude |
|---|---|---|---|---|---|---|
| TD | 1978 | 8 | 31 | 6pm | 29.3N | 99.2W |
| TS | 1978 | 7 | 31 | 6am | 28.0N | 98.2W |
Remember that calling .groupby('column name') sets the
column name to the index. This means the 'Status' column
will become the new bolded index, which is found in the leftmost column
of the data frame. Another thing to know is Python will organize strings
in the index in alphabetical order, so for example
TS and TD both start with T, but
D comes sooner in the alphabet than S, which
makes row TD come before row
TS.
Next it is important to look at the .max(), which tells
us that we want the maximum element of each column that correspond to
the unique 'Status'. Recall how .max()
interacts with strings: .max() will organize strings in the
columns in descending order, so the last alphabetically/numerically.
The average score on this problem was 59%.
Frank X. Kugler has Olympic medals in three sports (wrestling,
weightlifting, and tug of war), which is more sports than any other
Olympic medalist. Furthermore, his medals for all three of these sports
are included in the olympians DataFrame. Fill in the blanks
below so that the expression below evaluates to
"Frank X. Kugler".
                (olympians.groupby(__(a)__).__(b)__
                          .reset_index()
                          .groupby(__(c)__).__(d)__
                          .sort_values(by="Age", ascending=False)
.index[0])What goes in blank (a)?
Answer: ["Name", "Sport"] or
["Sport", "Name"]
The question wants us to find the name (Frank X. Kugler) who has
records that correspond to three distinct sports. We know that the same
athlete might have multiple records for a distinct sport if they
participated in the same sport for multiple years. Therefore we should
groupby "Name" and "Sport" to create a
DataFrame with unique Name-Sport pairs. This is a DataFrame that
contains the athletes and their sports (for each athlete, their
corresponding sports are distinct). If an athlete participated in 2
sports, for example, they would have 2 rows corresponding to them in the
DataFrame, 1 row for each distinct sport.
The average score on this problem was 75%.
What goes in blank (b)?
Answer: .sum() or .mean()
or .min(), etc.
Any aggregation method applied on df.groupby() would
work. We only want to remove cases in which an athlete participates in
the same sport for multiple years, and get unique name-sport pairs.
Therefore, we don’t care about the aggregated numeric value. Notice
.unique() is not correct because it is not an aggregation
method used on dataframe after grouping by. If you use
.unique(), it will give you “AttributeError:
‘DataFrameGroupBy’ object has no attribute ‘unique’”. However,
.unique() can be used after Series.groupby().
For more info: [link]
(https://pandas.pydata.org/docs/reference/api/pandas.core.groupby.SeriesGroupBy.unique.html)
The average score on this problem was 96%.
What goes in blank (c)?
Answer: "Name"
Now after resetting the index, we have "Name" and
"Sport" columns containing unique name-sport pairs. The
objective is to count how many different sports each Olympian has medals
in. To do that, we groupby "Name" and later use the
.count() method. This would give a new DataFrame that has a
count of how many times each name shows up in our previous DataFrame
with unique name-sport pairs.
The average score on this problem was 81%.
What goes in blank (d)?
Answer: .count()
The .count() method is applied to each group. In this
context, .count() will get the number of entries for each
Olympian across different sports, since the previous steps ensured each
sport per Olympian is uniquely listed (due to the initial groupby on
both "Name" and "Sport"). It does not matter
what we sort_values by, because the
.groupby('Name').count() method will just put a count of
each "Name" in all of the columns, regardless of the column
name or what value was originally in it.
The average score on this problem was 64%.
Each of the following expressions evaluates to an integer. Determine the value of that integer, if possible, or circle “not enough information."
Important: Before proceeding, make sure to read the page called Clue: The Murder Mystery Game.
(clue.get("Cardholder") == "Janine").sum() Answer: 6
This code counts the number of times that Janine appears in the
Cardholder column. This is because
clue.get("Cardholder") == "Janine" will return a Series of
True and False values of length 22 where
True corresponds to a card belonging to Janine. Since 6
cards were dealt to her, the expression evaluates to 6.
The average score on this problem was 78%.
np.count_nonzero(clue.get("Category").str.contains("p")) Answer: 13
This code counts the number of cells that contain that letter
"p" in the Category column.
clue.get("Category").str.contains("p") will return a Series
that contains True if "p" is part of the entry
in the "Category" column and False otherwise.
The words "suspect" and "weapons" both contain
the letter "p" and since there are 6 and 7 of each
respectively, the expression evaluates to 13.
The average score on this problem was 75%.
clue[(clue.get("Category") == "suspect") & (clue.get("Cardholder") == "Janine")].shape[0] Answer: not enough information
This code first filters only for rows that contain both
"suspect" as the category and "Janine" as the
cardholder and returns the number of rows of that DataFrame with
.shape[0]. However, from the information given, we do not
know how many "suspect" cards Janine has.
The average score on this problem was 83%.
len(clue.take(np.arange(5, 20, 3)).index) Answer: 5
np.arange(5, 20, 3) is the arary
np.array([5, 8, 11, 14, 17]). Recall that
.take will filter the DataFrame to contain only certain
rows, in this case rows 5, 8, 11, 14, and 17. Next, .index
extracts the index of the DataFrame, so the length of the index is the
same as the number of rows contained in the DataFrame. There are 5
rows.
The average score on this problem was 69%.
len(clue[clue.get("Category") >= "this"].index) Answer: 7
Similarly to the previous problem, we are getting the number of rows
of the DataFrame clue after filtering it.
clue.get("Category") >= "this" returns a Boolean Series
where True is returned when a string in "Category" is
greater than alphabetically than "this". This only happens
when the string is "weapon", which occurs 7 times.
The average score on this problem was 29%.
clue.groupby("Cardholder").count().get("Category").sum() Answer: 22
groupby("Cardholder").count() will return a DataFrame
indexed by "Cardholder" where each column contains the
number of cards that each "Cardholder" has. Then we sum the
values in the "Category" column, which evaluates to 22
because the sum of the total number of cards each cardholder has is the
total number of cards in play!
The average score on this problem was 52%.
An important part of the game is knowing when you’ve narrowed it down to just one suspect with one weapon in one room. Then you can make your accusation and win the game!
Suppose the DataFrames grouped and filtered
are defined as follows.
    grouped = (clue.reset_index()
                   .groupby(["Category", "Cardholder"])
                   .count()
                   .reset_index())
filtered = grouped[grouped.get("Cardholder") == "Unknown"]Fill in the blank below so that "Ready to accuse" is
printed when Janine has enough information to make an accusation and win
the game.
    if filtered.get("Card").______ == 3:
        print("Ready to accuse")
What goes in the blank?
count()
sum()
max()
min()
shape[0]
Answer: sum()
It is helpful to first visualize how both the grouped
(left) and filtered (right) DataFrames could look:
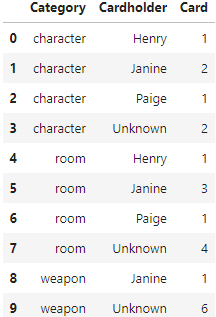
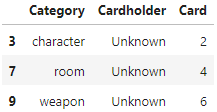
Now, let’s think about the scenario presented. We want a method that
will return 3 from filtered.get("Card").___. We do not use
count() because that is an aggregation function that
appears after a .groupby, and there is no grouping
here.
According to the instructions, we want to know when we narrowed it
down to just one suspect with one weapon in one room.
This means for filtered DataFrame, each row should have 1
in the "Card" column when you are already to accuse.
sum() works because when you have only 1 unknown card for
each of the three categories, that means you have a sum of 3 unknown
cards in total. You can make an accusation now!
The average score on this problem was 50%.
Now, let’s look at a different way to do the same thing. Fill in the
blank below so that "Ready to accuse" is printed when
Janine has enough information to make an accusation and win the
game.
    if filtered.get("Card").______ == 1:
        print("Ready to accuse")
What goes in the blank?
count()
sum()
max()
min()
shape[0]
Answer: max()
This problem follows the same logic as the first except we only want
to accuse when filtered.get("Card").___ == 1. As we saw in
the previous part, we only want to accuse when all the numbers in the
"Card" column are 1, as this represents one unknown in each
category. This means the largest number in the "Card"
column must be 1, so we can fill in the blank with
max().
The average score on this problem was 40%.
Fill in the blanks so that rotten_apple evaluates to the
number of laptops manufactured by "Apple" that are priced
below the median price of all laptops.
x = __(a)__
y = __(b)__
rotten_apple = laptops[x __(c)__ y].__(d)__Note: (a) and (b) are interchangeable
Answer (a):
laptops.get("Mfr") == "Apple"
The average score on this problem was 71%.
Answer (b):
laptops.get("Price") < laptops.get("Price").median()
The average score on this problem was 71%.
Answer (c): &
The average score on this problem was 43%.
Answer (d): shape[0]
The average score on this problem was 43%.
Using groupby, write an expression that
evaluates to the average price of laptops with the "macOS"
operating system.
Answer:
laptops.groupby("OS").mean().get("Price").loc["macOS"]
The average score on this problem was 72%.
Without using groupby, write an
expression that evaluates to the average price of laptops with the
"macOS" operating system (the same quantity as above).
Answer:
laptops[laptops.get("OS") == "macOS"].get("Price").mean()
The average score on this problem was 71%.
The Death Eaters are a powerful group of dark wizards who oppose
Harry Potter and his allies. Each Death Eater receives a unique
identification number based on their order of initiation, ranging from
1 to N, where N represents the
total number of Death Eaters.
Your task is to estimate the value of N so you can
understand how many enemies you face. You have a random sample of
identification numbers in a DataFrame named death_eaters
containing a single column called "ID".
Which of the options below would be an appropriate estimate for the total number of Death Eaters? Select all that apply.
death_eaters.get("ID").max()
death_eaters.get("ID").sum()
death_eaters.groupby("ID").count()
int(death_eaters.get("ID").mean() * 2)
death_eaters.shape[0]
None of the above.
Answer: death_eaters.get("ID").max()
and int(death_eaters.get("ID").mean() * 2)
Option 1: death_eaters.get("ID").max() returns the
maximum ID from the sample. This is an appropriate estimate since the
population size must be at least the size of the largest ID in our
sample. For instance, if the maximum ID observed is 250, then the total
number of Death Eaters must be at least 250.
Option 2: death_eaters.get("ID").sum() returns the
sum of all ID numbers in the sample. The total sum of IDs has no
meaningful connection to the population size, which makes this an
inappropriate estimate.
Option 3: death_eaters.groupby("ID").count() groups
the data by ID and counts occurrences. Since each ID is unique and
death_eaters only includes the "ID" column,
grouping simply shows that each ID appears once. This is not an
appropriate estimate for N.
Option 4: int(death_eaters.get("ID").mean() * 2)
returns twice the mean of the sample IDs as an integer. The mean of a
random sample of the numbers 1 through N usually falls
about halfway between 1 and N. So we can appropriately
estimate N by doubling this mean.
Option 5: death_eaters.shape[0] returns the number
of rows in death_eaters (ie. the sample size). The sample
size does not reflect the total population size, making it an
inappropriate estimate.
The average score on this problem was 66%.
Each box that you selected in part (a) is an example of what?
a distribution
a statistic
a parameter
a resample
Answer: a statistic
The options in part (a) calculate a numerical value from the random
sample death_eaters. This fits the definition of a
statistic.
The average score on this problem was 82%.
Suppose you have access to a function called estimate,
which takes in a Series of Death Eater ID numbers and returns an
estimate for N. Fill in the blanks below to do the
following:
Create an array named boot_estimates, containing
10,000 of these bootstrapped estimates of N, based on the
data in death_eaters.
Set left_72 to the left endpoint of
a 72% confidence interval for N.
    boot_estimates = np.array([])

    for i in np.arange(10000):
        boot_estimates = np.append(boot_estimates, __(a)__)

    left_72 = __(b)__
What goes in blank (a)?
Answer:
estimate(death_eaters.sample(death_eaters.shape[0], replace=True).get("ID"))
In the given code, we use a for loop to generate 10,000 bootstrapped
estimates of N and append them to the array
boot_estimates. Blank (a) specifically computes one
bootstrapped estimate of N. Here’s how key parts of the
solution work:
death_eaters.sample(death_eaters.shape[0], replace=True):
To bootstrap, we need to resample the data with replacement. The
sample() function
(see
here) takes as arguments the sample size
(death_eaters.shape[0]) and whether to replace
(replace=True).
.get("ID"): Since estimate() takes a
Series as input, we need to extract the ID column from the
resample.
estimate(): The resampled ID column is passed into
the estimate() function to generate one bootstrapped
estimate of N.
The average score on this problem was 62%.
What goes in blank (b)?
Answer:
np.percentile(boot_estimates, 14)
A 72% confidence interval captures the middle 72% of our
distribution. This leaves 28% of the data outside the interval, with 14%
from the lower tail and 14% from the upper tail. Thus, the left endpoint
corresponds to the 14th percentile of boot_estimates. The
np.percentile() function
(see
here) takes as arguments the array to compute the percentile
(boot_estimates) and the desired percentile (14).
The average score on this problem was 91%.
With more students requesting online courses, the Registrar wants to
know how many online courses are offered by the CSE department.
Select all expressions that correctly evaluate to an
int that is the total number of online CSE courses in
courses.
courses[(courses.get("Department") == "CSE") & (courses.get("Online"))]
courses.groupby("Department").sum().get("Online").loc["CSE"]
((courses.get("Department") == "CSE") & (courses.get("Online"))).shape[0]
((courses.get("Department") == "CSE") & (courses.get("Online"))).sum()
None of the above.
Answer: Select
courses.groupby("Department").sum().get("Online").loc["CSE"]
and
((courses.get("Department") == "CSE") & (courses.get("Online"))).sum().
We need an int equal to the number of
courses that are both CSE and online.
int.groupby("Department").sum() aggregates;
for boolean columns, .sum() counts
True values.
.get("Online").loc["CSE"] is the count of online courses in
CSE — an integer. Correct.((...) & (...)) is a boolean Series
with one entry per row; .shape[0] is the
length of that Series (total number of courses), not
how many are True. Incorrect.True values (online CSE rows).
Correct.
The average score on this problem was 52%.