
← return to practice.dsc10.com
Instructor(s): Janine Tiefenbruck
This exam was administered in-person. The exam was closed-notes, except students were provided a copy of the DSC 10 Reference Sheet. No calculators were allowed. Students had 50 minutes to take this exam.
Note (groupby / pandas 2.0): Pandas 2.0+ no longer
silently drops columns that can’t be aggregated after a
groupby, so code written for older pandas may behave
differently or raise errors. In these practice materials we use
.get() to select the column(s) we want after
.groupby(...).mean() (or other aggregations) so that our
solutions run on current pandas. On real exams you will not be penalized
for omitting .get() when the old behavior would have
produced the same answer.
Welcome to Sun God!
After a two-year hiatus due to the pandemic, UCSD’s annual music
festival, the Sun God festival, is back this year! In this exam, we’ll
be looking at a DataFrame named sungod that contains
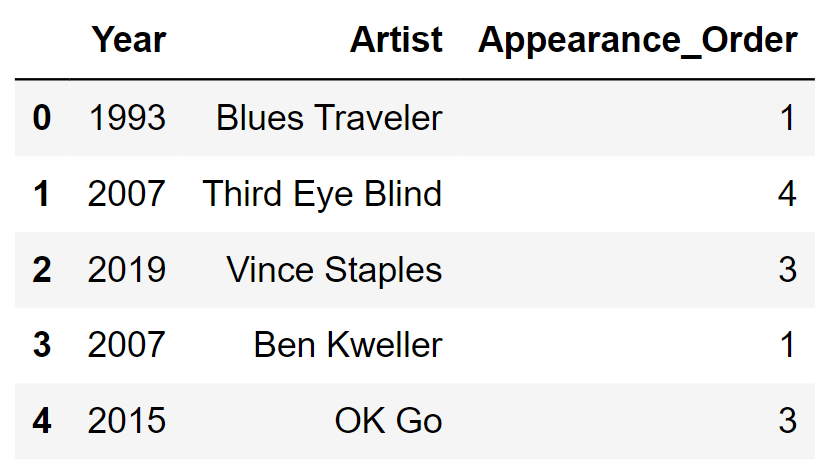
information on the artists who have performed at Sun God in years past.
For each year that the festival was held, we have one row for
each artist that performed that year. The columns are:
'Year' (int): the year of the
festival'Artist' (str): the name of the
artist'Appearance_Order' (int): the order in
which the artist appeared in that year’s festival (1 means they came
onstage first)The rows of sungod are arranged in no particular
order. The first few rows of sungod are shown
below (though sungod has many more rows
than pictured here).
Assume:
'Year' of 2015 and an
'Appearance_Order' of 3).import babypandas as bpd and
import numpy as np.Throughout this exam, we will refer to sungod
repeatedly.
Tip: Open this page in another tab, so that it is easy to refer to this data description as you work through the exam.
Which of the following is a valid reason not to set
the index of sungod to 'Artist'?
Select all correct answers.
Two different artists have the same name.
An artist performed at Sun God in more than one year.
Several different artists performed at Sun God in the same year.
Many different artists share the same value of
'Appearance_Order'.
None of the above.
Answer: Two different artists have the same name., An artist performed at Sun God in more than one year.
For this question, it is crucial to know that an index should not
contain duplicate values, so we need to consider reasons why
'Artist' might contain two values that are the same. Let’s
go through the answer choices in order.
For the first option, if two different artists had the same name,
this would lead to duplicate values in the 'Artist' column.
Therefore, this is a valid reson not to index sungod by
'Artist'.
For the second option, if one artist performed at Sun God in more
than one year, their name would appear multiple times in the
'Artist' column, once for each year they performed. This
would also be a valid reason not to index sungod by
'Artist'.
For the third option, if several different artists performed at Sun
God in the same year, that would not necessarily create duplicates in
the 'Artist' column, unless of course two of the artists
had the same name, which we’ve already addressed in the first answer
choice. This is not a valid reason to avoid indexing sungod
by 'Artist'.
For the last answer choice, if many different artists share the same
value of 'Appearance_Order', this would not create
duplicates in the 'Artist' column. Therefore, this is also
not a valid reason to avoid indexing sungod by
'Artist'.
The average score on this problem was 83%.
On the graph paper below, draw the histogram that would be produced by this code.
(
sungod.take(np.arange(5))
      .plot(kind='hist', density=True,
      bins=np.arange(0, 7, 2), y='Appearance_Order');
)
In your drawing, make sure to label the height of each bar in the histogram on the vertical axis. You can scale the axes however you like, and the two axes don’t need to be on the same scale.

Answer:
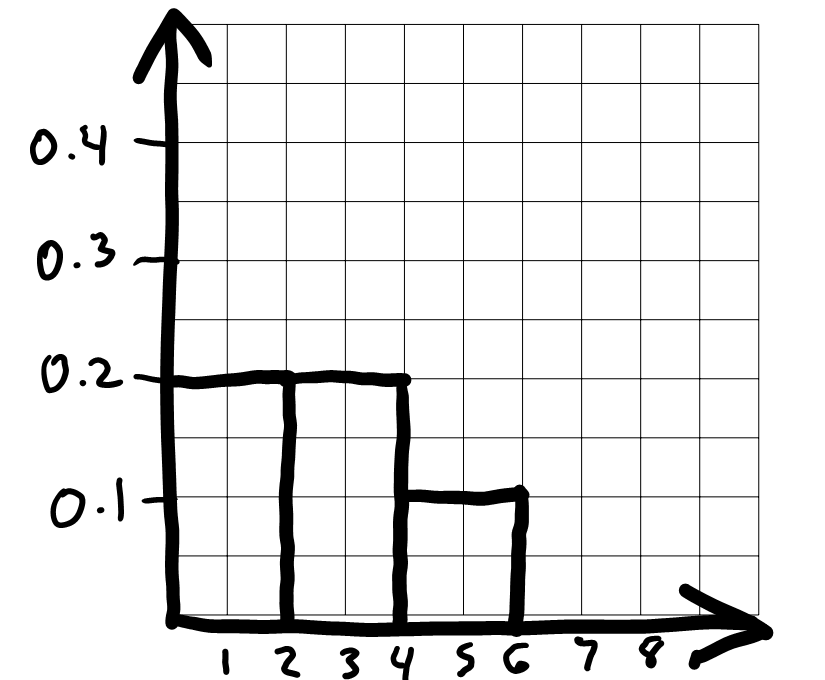
To draw the histogram, we first need to bin the data and figure out
how many data values fall into each bin. The code includes
bins=np.arange(0, 7, 2) which means the bin endpoints are
0, 2, 4, 6. This gives us three bins:
[0, 2), [2,
4), and [4, 6]. Remember that
all bins, except for the last one, include the left endpoint but not the
right. The last bin includes both endpoints.
Now that we know what the bins are, we can count up the number of
values in each bin. We need to look at the
'Appearance_Order' column of
sungod.take(np.arange(5)), or the first five rows of
sungod. The values there are 1,
4, 3, 1, 3. The two 1s fall into
the first bin [0, 2). The two 3s fall into the second bin [2, 4), and the one 4 falls into the last bin [4, 6]. This means the proportion of values
in each bin are \frac{2}{5}, \frac{2}{5},
\frac{1}{5} from left to right.
To figure out the height of each bar in the histogram, we use the fact that the area of a bar in a density histogram should equal the proportion of values in that bin. The area of a rectangle is height times width, so height is area divided by width.
For the bin [0, 2), the area is \frac{2}{5} = 0.4 and the width is 2, so the height is \frac{0.4}{2} = 0.2.
For the bin [2, 4), the area is \frac{2}{5} = 0.4 and the width is 2, so the height is \frac{0.4}{2} = 0.2.
For the bin [4, 6], the area is \frac{1}{5} = 0.2 and the width is 2, so the height is \frac{0.2}{2} = 0.1.
Since the bins are all the same width, the fact that there an equal number of values in the first two bins and half as many in the third bin means the first two bars should be equally tall and the third should be half as tall. We can use this to draw the rest of the histogram quickly once we’ve drawn the first bar.
The average score on this problem was 45%.
Suppose in a new cell, we type the following.
sungod.sort_values(by='Year')After we run that cell, we type the following in a second cell.
sungod.get('Artist').iloc[0]What is the output when we run the second cell? Note that the first Sun God festival was held in 1983.
'Blues Traveler'
The artist who appeared on stage first in 1983.
An artist who appeared in 1983, but not necessarily the one who appeared first.
Not enough information to tell.
Answer: 'Blues Traveler'
In the first cell, although we seem to be sorting sungod
by 'Year', we aren’t actually changing the DataFrame
sungod at all because we don’t save the sorted DataFrame.
Remember that DataFrame methods don’t actually change the underlying
DataFrame unless you explicitly make that happen by saving the output as
the name of the DataFrame. So the first 'Artist' name will
still be 'Blues Traveler'.
Suppose we had saved the sorted DataFrame as in the code below.
    sungod = sungod.sort_values(by='Year')
    sungod.get('Artist').iloc[0]
In this case, the output would be the name of an artist who appeared in 1983, but not necessarily the one who appeared first. There will be several artists associated with the year 1983, and we don’t know which of them will be first in the sorted DataFrame.
The average score on this problem was 12%.
Write one line of code below to create a DataFrame called
openers containing the artists that appeared first on stage
at a past Sun God festival. The DataFrame openers should
have all the same columns as sungod.
Answer:
openers = sungod[sungod.get('Appearance_Order')==1]
Since we want only certain rows of sungod, we need to
query. The condition to satisfy is that the
'Appearance_Order' column should have a value of 1 to
indicate that this artist performed first in a certain year’s
festival.
The average score on this problem was 84%.
What was the largest number of artists that ever performed in a single Sun God festival? Select all expressions that evaluate to the correct answer.
sungod.groupby('Appearance_Order').count().get('Year').max()
sungod.groupby('Year').count().get('Artist').max()
sungod.get('Appearance_Order').max()
sungod.groupby('Year').max().get('Year').max()
None of the above.
Answer:
sungod.groupby('Year').count().get('Artist').max(),
sungod.get('Appearance_Order').max()
Let’s go through all the answer choices.
For the first option,
sungod.groupby('Appearance_Order').count() will create a
DataFrame with one row for each unique value of
'Appearance_Order', and each column will contain the same
value, which represents the number of Sun God festivals that had at
least a certain amount of performers. For example, the first row of
sungod.groupby('Appearance_Order').count() will correspond
to an 'Appearance_Order' of 1, and each column will contain
a count of the number of Sun God festivals with at least one performer.
Since every festival has at least one performer, the largest count in
any column, including 'Year' will be in this first row. So
sungod.groupby('Appearance_Order').count().get('Year').max()
represents the total number of Sun God festivals, which is not the
quantity we’re trying to find.
For the second option, sungod.groupby('Year').count()
will create a DataFrame with one row per year, with each column
containing a count of the number of artists that performed in that
year’s festival. If we take the largest such count in any one column, we
are finding the largest number of artists that ever performed in a
single Sun God festival. Therefore,
sungod.groupby('Year').count().get('Artist').max() is
correct.
The third option works because we can find the desired quantity by
simply looking for the largest value in the
'Appearance_Order' column. For example, if the largest
number of artists to ever perform in a Sun God festival was, say, 17,
then for that year’s festival, the last artist to appear would have a
value of 17 in the 'Appearance_Order' column. There can be
no 18 anywhere in the 'Appearance_Order' column, otherwise
that would mean there was some festival with 18 performers. Therefore,
sungod.get('Appearance_Order').max() is correct.
The fourth option is not even correct Python code. The DataFrame
produced by sungod.groupby('Year').max() is indexed by
'Year' and no longer has 'Year' as a column.
So we’d get an error if we tried to access this nonexistent column, as
in sungod.groupby('Year').max().get('Year').
The average score on this problem was 78%.
Fill in the blank in the code below so that
chronological is a DataFrame with the same rows as
sungod, but ordered chronologically by appearance on stage.
That is, earlier years should come before later years, and within a
single year, artists should appear in the DataFrame in the order they
appeared on stage at Sun God. Note that groupby
automatically sorts the index in ascending order.
chronological = sungod.groupby(___________).max().reset_index() ['Year', 'Artist', 'Appearance_Order']
['Year', 'Appearance_Order']
['Appearance_Order', 'Year']
None of the above.
Answer:
['Year', 'Appearance_Order']
The fact that groupby automatically sorts the index in
ascending order is important here. Since we want earlier years before
later years, we could group by 'Year', however if we
just group by year, all the artists who performed in a given
year will be aggregated together, which is not what we want. Within each
year, we want to organize the artists in ascending order of
'Appearance_Order'. In other words, we need to group by
'Year' with 'Appearance_Order' as subgroups.
Therefore, the correct way to reorder the rows of sungod as
desired is
sungod.groupby(['Year', 'Appearance_Order']).max().reset_index().
Note that we need to reset the index so that the resulting DataFrame has
'Year' and 'Appearance_Order' as columns, like
in sungod.
The average score on this problem was 85%.
Another DataFrame called music contains a row for every
music artist that has ever released a song. The columns are:
'Name' (str): the name of the music
artist'Genre' (str): the primary genre of the
artist'Top_Hit' (str): the most popular song by
that artist, based on sales, radio play, and streaming'Top_Hit_Year' (int): the year in which
the top hit song was releasedYou want to know how many musical genres have been represented at Sun
God since its inception in 1983. Which of the following expressions
produces a DataFrame called merged that could help
determine the answer?
merged = sungod.merge(music, left_on='Year', right_on='Top_Hit_Year')
merged = music.merge(sungod, left_on='Year', right_on='Top_Hit_Year')
merged = sungod.merge(music, left_on='Artist', right_on='Name')
merged = music.merge(sungod, left_on='Artist', right_on='Name')
Answer:
merged = sungod.merge(music, left_on='Artist', right_on='Name')
The question we want to answer is about Sun God music artists’
genres. In order to answer, we’ll need a DataFrame consisting of rows of
artists that have performed at Sun God since its inception in 1983. If
we merge the sungod DataFrame with the music
DataFrame based on the artist’s name, we’ll end up with a DataFrame
containing one row for each artist that has ever performed at Sun God.
Since the column containing artists’ names is called
'Artist' in sungod and 'Name' in
music, the correct syntax for this merge is
merged = sungod.merge(music, left_on='Artist', right_on='Name').
Note that we could also interchange the left DataFrame with the right
DataFrame, as swapping the roles of the two DataFrames in a merge only
changes the ordering of rows and columns in the output, not the data
itself. This can be written in code as
merged = music.merge(sungod, left_on='Name', right_on='Artist'),
but this is not one of the answer choices.
The average score on this problem was 86%.
Consider an artist that has only appeared once at Sun God. At the time of their Sun God performance, we’ll call the artist
Complete the function below so it outputs the appropriate description for any input artist who has appeared exactly once at Sun God.
def classify_artist(artist):
    filtered = merged[merged.get('Artist') == artist]
    year = filtered.get('Year').iloc[0]
    top_hit_year = filtered.get('Top_Hit_Year').iloc[0]
    if ___(a)___ > 0:
        return 'up-and-coming'
    elif ___(b)___:
        return 'outdated'
    else:
return 'trending'What goes in blank (a)?
Answer: top_hit_year - year
Before we can answer this question, we need to understand what the
first three lines of the classify_artist function are
doing. The first line creates a DataFrame with only one row,
corresponding to the particular artist that’s passed in as input to the
function. We know there is just one row because we are told that the
artist being passed in as input has appeared exactly once at Sun God.
The next two lines create two variables:
year contains the year in which the artist performed at
Sun God, andtop_hit_year contains the year in which their top hit
song was released.Now, we can fill in blank (a). Notice that the body of the
if clause is return 'up-and-coming'. Therefore
we need a condition that corresponds to up-and-coming, which we are told
means the top hit came out after the artist appeared at Sun God. Using
the variables that have been defined for us, this condition is
top_hit_year > year. However, the if
statement condition is already partially set up with > 0
included. We can simply rearrange our condition
top_hit_year > year by subtracting year
from both sides to obtain top_hit_year - year > 0, which
fits the desired format.
The average score on this problem was 89%.
What goes in blank (b)?
Answer: year-top_hit_year > 5
For this part, we need a condition that corresponds to an artist
being outdated which happens when their top hit came out more than five
years prior to their appearance at Sun God. There are several ways to
state this condition: year-top_hit_year > 5,
year > top_hit_year + 5, or any equivalent condition
would be considered correct.
The average score on this problem was 89%.
The expression below evaluates to True.
(
classify_artist('Michelle Branch')=='outdated'
and
classify_artist('Drake')=='trending'
)
Consider the scatterplot created by the code below.
merged.plot(kind='scatter', x='Year', y='Top_Hit_Year');The point for Drake is somewhere in this scatterplot. Relative to the point for Drake, there are four quadrants of the scatterplot, as shown below.
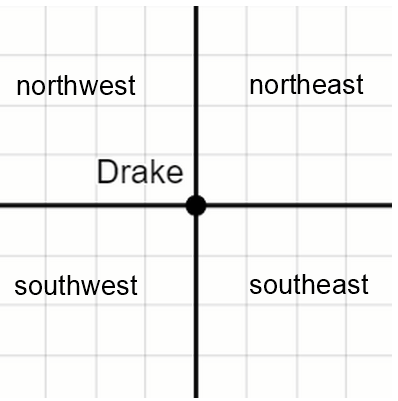
There is one quadrant in which the point for Michelle Branch cannot appear. Which is it?
northeast
northwest
southwest
southeast
Answer: northwest
The scatterplot shows an artist’s year of performance at Sun God on the x-axis, and their top hit year on the y-axis.
Since Drake is considered trending, we know his top hit came out within the five years prior to his Sun God performance. In other words, the time gap between his top hit release and his Sun God performance is at most five years.
If Michelle Branch were in the northwest quadrant, that would mean her x-coordinate was smaller than Drake’s, and her y-coordinate was larger. In other words, that would mean she performed at Sun God before Drake and her top hit was released after Drake’s. This means the time gap between her top hit release and her Sun God performance is less than five years, so she could not be considered outdated.
We could also answer this question through process of elimination. This would entail finding scenarios that show each of the other three quadrants is possible.
Michelle Branch could wind up in the northeast quadrant if, say, she performed 10 years after Drake and released her top hit 1 year after Drake. She’d be considered outdated because the time gap between her top hit and her Sun God performance would exceed five years.
Similarly, Michelle Branch could be in the southwest quadrant if, say, she performed 1 year before Drake and released her top hit 10 years before Drake. Again, the time gap between her top hit and her Sun God performance would exceed five years, making her outdated.
She could also be in the southeast quadrant if, say, she performed 10 years after Drake and released her top hit 10 years before Drake. This would also make the time gap between her top hit and Sun God performance more than five years.
So since all three other quadrants are possible and we are told that one quadrant is impossible, the northwest quadrant must be impossible.
The average score on this problem was 65%.
Note: This problem is out of scope; it covers material no longer included in the course.
In 2014, the UCSD administration made some important changes to Sun God policies, including:
These changes were implemented because of incidents related to drug and alcohol abuse at the festival. At the 2013 Sun God festival, 48 students were hospitalized, and at the 2014 festival, only 8 students were hospitalized. Assuming there was no change in the total number of attendees from 2013 to 2014, which of the following statements is correct?
We cannot be sure if there is an association between administrative changes and hospitalizations.
There is an association between administrative changes and hospitalizations. One or more of the administrative changes is responsible for the decrease in hospitalizations, but since several administrative changes happened at the same time, we can’t be sure of which one to credit with the reduction in hospitalizations.
There is an association between administrative changes and hospitalizations. We can’t be sure if any of the administrative changes are responsible for the reduction in hospitalizations.
None of the above.
Answer: There is an association between administrative changes and hospitalizations. We can’t be sure if any of the administrative changes are responsible for the reduction in hospitalizations.
We know there is an association between administrative changes and hospitalizations because the number of hospitalized students dropped after the changes went into effect.
However, since no randomized controlled trial was done, we can’t be sure of the reason for the reduction in hospitalizations. For example, maybe there were fewer hospitalizations because a new flavor of sparkling water came out in 2014, and people drank that instead of alcohol. We just don’t know enough to conclude any causal explanation for the reduction in hospitalizations.
The average score on this problem was 54%.
The fine print of the Sun God festival website says “Ticket does not
guarantee entry. Venue subject to capacity restrictions.” RIMAC field,
where the 2022 festival will be held, has a capacity of 20,000 people.
Let’s say that UCSD distributes 21,000 tickets to Sun God 2022 because
prior data shows that 5% of tickets distributed are never actually
redeemed. Let’s suppose that each person with a ticket this year has a
5% chance of not attending (independently of all others). What is the
probability that at least one student who has a ticket cannot get in due
to the capacity restriction? Fill in the blanks in the code below so
that prob_angry_student evaluates to an approximation of
this probability.
num_angry = 0

for rep in np.arange(10000):
    # randomly choose 21000 elements from [True, False] such that
    # True has probability 0.95, False has probability 0.05
    attending = np.random.choice([True, False], 21000, p=[0.95, 0.05])
    if __(a)__:
        __(b)__

prob_angry_student = __(c)__What goes in the first blank?
np.count_nonzero(attending) == 20001
attending[20000] == False
attending.sum() > 20000
np.count_nonzero(attending) > num_angry
Answer: attending.sum() > 20000
Let’s look at the variable attending. Since we’re
choosing 21,000 elements from the list [True, False] and
there are 21,000 tickets distributed, this code is randomly determining
whether each ticket holder will actually attend the festival. There’s a
95% chance of each ticket holder attending, which is reflected in the
p=[0.95, 0.05] argument. Remember that
np.random.choice returns an array of random choices, which
in this case means it will contain 21,000 elements, each of which is
True or False.
We want to figure out the probability of at least one ticket holder
showing up and not being admitted. Another way to say this is we want to
find the probability that more than 20,000 ticket holders show up to
attend the festival. The way we approximate a probability through
simulation is we repeat a process many times and see how often some
event occurred. The event we’re interested in this case is that more
than 20,000 ticket holders came to Sun God. Since we have an array of
True and False values corresponding to whether
each ticket holder actually came, we just need to determine if there are
more than 20,000 True values in the attending
array.
There are several ways to count the number of True
values in a Boolean array. One way is to sum the array since in Python
True counts as 1 and False counts as 0.
Therefore, attending.sum() > 20000 is the condition we
need to check here.
The average score on this problem was 67%.
What goes in the second blank?
Answer: num_angry = num_angry + 1
Remember our goal in simulation is to repeat a process many times to
see how often some event occurs. The repetition comes from the
for loop which runs 10,000 times. Each time, we are
simulating the process of 21,000 students each randomly deciding whether
to show up to Sun God or not. We want to know, out of these 10,000
trials, how frequently more than 20,000 of the students will show up. So
when this happens, we want to record that it happened. The standard way
to do that is to keep a counter variable that starts at 0 and gets
incremented, or increased by one, each time we had more than 20,000
attendees in our simulation.
The framework to do this is already set up because a variable called
num_angry is initialized to 0 before the for
loop. This variable is our counter variable, meant to count the number
of trials, out of 10,000, that resulted in at least one student being
angry because they showed up to Sun God with a ticket and were denied
entrance. So all we need to do when there are more than 20,000
True values in the attending array is
increment this counter by one via the code
num_angry = num_angry + 1, sometimes abbreviated as
num_angry += 1.
The average score on this problem was 59%.
What goes in the third blank?
Answer: num_angry/10000
To calculate the approximate probability, all we need to do is divide the number of trials in which a student was angry by the total number of trials, which is 10,000.
The average score on this problem was 68%.
You’re definitely going to Sun God 2022, but you don’t want to go alone! Fortunately, you have n friends who promise to go with you. Unfortunately, your friends are somewhat flaky, and each has a probability p of actually going (independent of all others). What is the probability that you wind up going alone? Give your answer in terms of p and n.
Answer: (1-p)^n
If you go alone, it means all of your friends failed to come. We can think of this as an and condition in order to use multiplication. The condition is: your first friend doesn’t come and your second friend doesn’t come, and so on. The probability of any individual friend not coming is 1-p, so the probability of all your friends not coming is (1-p)^n.
The average score on this problem was 76%.
In past Sun God festivals, sometimes artists that were part of the lineup have failed to show up! Let’s say there are n artists scheduled for Sun God 2022, and each artist has a probability p of showing up (independent of all others). What is the probability that the number of artists that show up is less than n, meaning somebody no-shows? Give your answer in terms of p and n.
Answer: 1-p^n
It’s actually easier to figure out the opposite event. The opposite of somebody no-showing is everybody shows up. This is easier to calculate because we can think of it as an and condition: the first artist shows up and the second artist shows up, and so on. That means we just multiply probabilities. Therefore, the probability of all artists showing up is p^n and the probability of some artist not showing up is 1-p^n.
The average score on this problem was 73%.