← return to practice.dsc10.com
Instructor(s): Suraj Rampure
This exam was administered in-person. The exam was closed-notes, except students were provided a copy of the DSC 10 Reference Sheet. No calculators were allowed. Students had 50 minutes to take this exam.
Note (groupby / pandas 2.0): Pandas 2.0+ no longer
silently drops columns that can’t be aggregated after a
groupby, so code written for older pandas may behave
differently or raise errors. In these practice materials we use
.get() to select the column(s) we want after
.groupby(...).mean() (or other aggregations) so that our
solutions run on current pandas. On real exams you will not be penalized
for omitting .get() when the old behavior would have
produced the same answer.
Here are two walkthrough videos of Problems 4 through 8 on this exam: one by Janine and one by Suraj.
Recall, at the start of the quarter, you were asked to complete a Welcome Survey to tell us about your background coming into the course. You were also asked to share seemingly irrelevant details, like the number of followers you have on Instagram and the number of unread emails in your primary email account. Well, those details are no longer irrelevant – in this exam, we will work with the data from this quarter’s Welcome Survey!
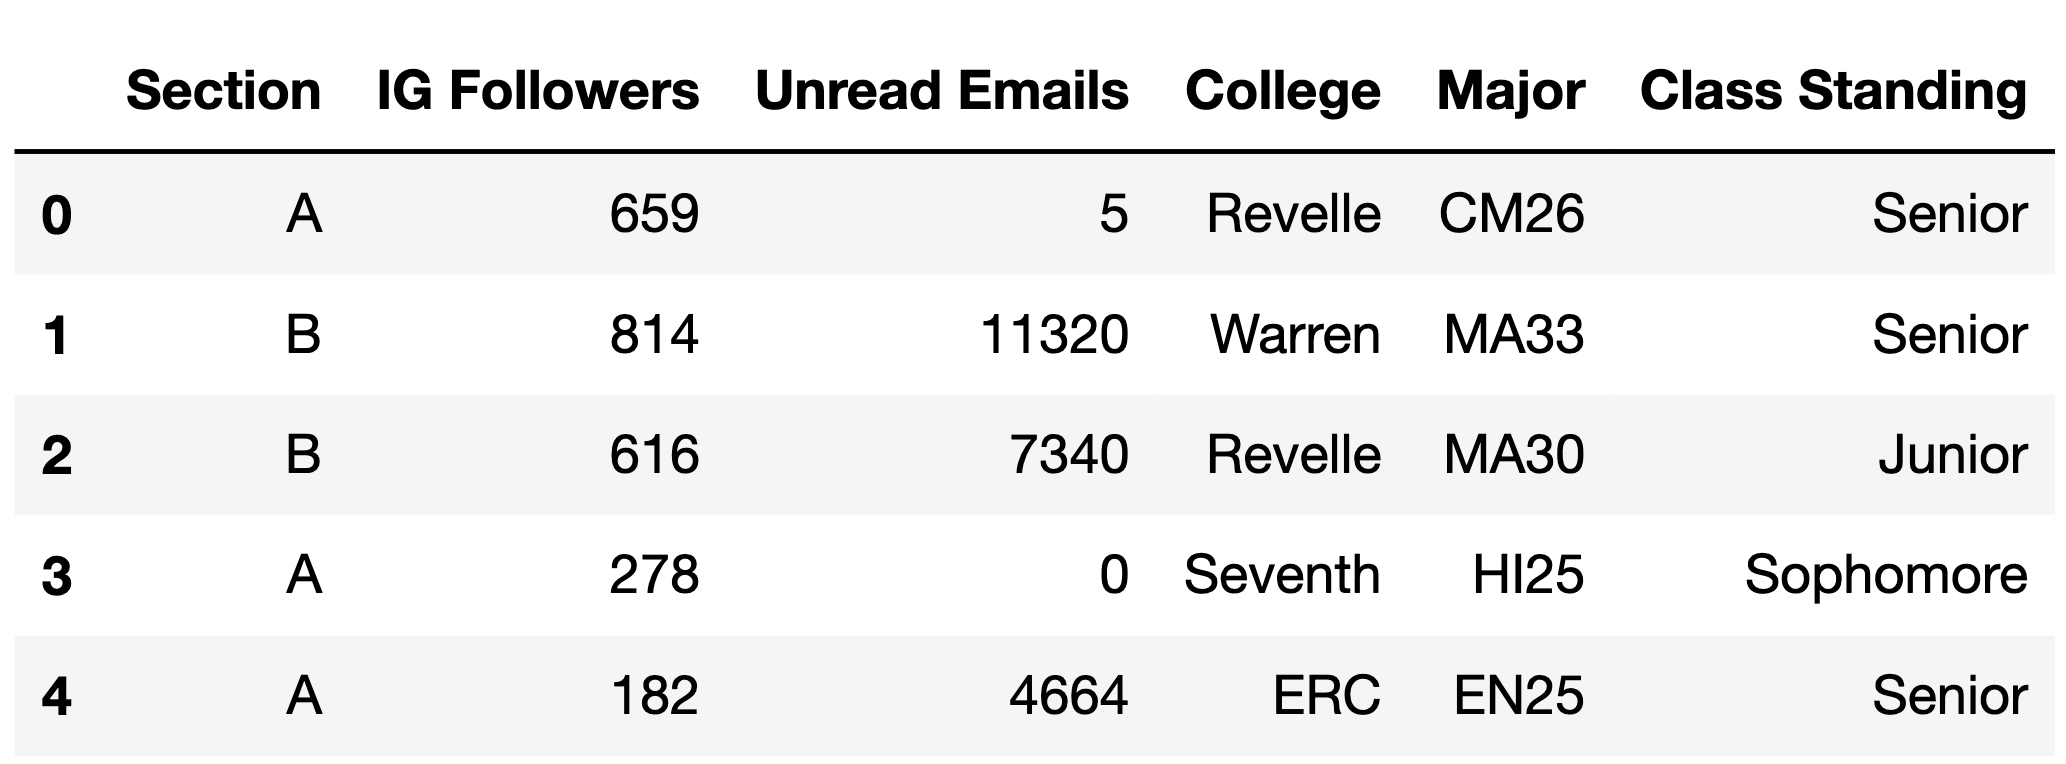
Each row in the DataFrame survey represents one student
in DSC 10. The information stored in the columns of survey
are as follows:
"Section" (str): The lecture section the
student is enrolled in (either "A" or
"B")."IG Followers" (int): The number of
followers the student has on Instagram. If the student does not have an
Instagram account, this number is 0."Unread Emails" (int): The number of
unread emails in the student’s primary email account."College" (str): The college the student
is a member of (either "ERC", "Marshall",
"Muir", "Revelle", "Seventh",
"Sixth" or "Warren")."Major" (str): The student’s primary
major, in major code form. For instance, the major code for the Data
Science major is "DS25"."Class Standing" (str): The student’s
class standing (either "Freshman",
"Sophomore", "Junior", or
"Senior").The first few rows of survey are shown below, though
survey has many more rows than are pictured below (since
there are more than 5 students in DSC 10 this quarter).
Throughout this exam, we will refer to survey
repeatedly.
Assume that we have already run import babypandas as bpd
and import numpy as np.
What is the type of the following expression?
(survey
 .sort_values(by="Class Standing")
)
int or float
list or array
Boolean
Series
string
DataFrame
Answer: DataFrame
The method .sort_values(by="Class Standing") sorts the
survey DataFrame by the "Class Standing"
column and returns a new DataFrame (without modifying the original one).
The resulting DataFrame will be sorted by class standing in ascending
order unless specified otherwise by providing the
ascending=False argument.
The average score on this problem was 94%.
What is the type of the following expression?
(survey
 .sort_values(by="Class Standing")
 .groupby("College").count()
)
int or float
list or array
Boolean
Series
string
DataFrame
Answer: DataFrame
The method .sort_values(by="Class Standing") sorts the
survey DataFrame based on the entries in the
"Class Standing" column and produces a new DataFrame.
Following this, .groupby("College") organizes the sorted
DataFrame by grouping entries using the "College" column.
After that, the .count() aggregation method computes the
number of rows for each "College". The result is a
DataFrame whose index contains the unique values in
"College" and whose columns all contain the same values –
the number of rows in
survey.sort_values(by="Class Standing") for each
"College".
Note that if we didn’t sort before grouping – that is, if our
expression was just survey.groupby("College").count() – the
resulting DataFrame would be the same! That’s because the order of the
rows in survey does not impact the number of rows in
survey that belong to each "College".
The average score on this problem was 93%.
What is the type of the following expression?
(survey
 .sort_values(by="Class Standing")
 .groupby("College").count()
 .get("IG Followers")
)
int or float
list or array
Boolean
Series
string
DataFrame
Answer: Series
The above expression, before .get("IG Followers"), is
the same as in the previous subpart. We know that
survey.sort_values(by="Class Standing").groupby("College").count()is a DataFrame indexed by "College" with multiple
columns, each of which contain the number of rows in
survey.sort_values(by="Class Standing") for each
"College". Then, using .get("IG Followers")
extracts just the "IG Followers" column from the
aforementioned counts DataFrame, and we know that columns are stored as
Series. We know that this column exists, because
survey.sort_values(by="Class Standing").groupby("College").count()
will have the same columns as survey, minus
"College", which was moved to the index.
The average score on this problem was 92%.
What is the type of the following expression?
(survey
 .sort_values(by="Class Standing")
 .groupby("College").count()
 .get("IG Followers")
 .iloc[0]
)
int or float
list or array
Boolean
Series
string
DataFrame
Answer: int or float
In the previous subpart, we saw that
survey.sort_values(by="Class Standing").groupby("College").count().get("IG Followers")is a Series whose index contains the unique names of
"College"s and whose values are the number of rows in
survey.sort_values(by="Class Standing") for each college.
The number of rows in
survey.sort_values(by="Class Standing") for any particular
college – say, "Sixth" – is a number, and so the values in
this Series are all numbers. As such, the answer is int or float.
The average score on this problem was 91%.
What value does the following expression evaluate to? If you believe the expression errors, provide a one sentence explanation of why.
For example, if you think the expression evaluates to an int, don’t
write “int" or”the largest value in the "IG Followers"
column", write the specific int, like “23".
Hint: You have enough information to answer the problem; don’t forget to look at the data description page.
(survey
.sort_values(by="Class Standing")
.groupby("College").count()
.get("IG Followers")
.index[0]
)Answer: "ERC"
From the previous subpart, we saw that
survey
.sort_values(by="Class Standing")
.groupby("College").count()
.get("IG Followers")
is a Series, indexed by "College", whose values contain
the number of rows in
survey.sort_values(by="Class Standing") for each
"College". When we group by "College", the
resulting DataFrame (and hence, our Series) is sorted in ascending order
by "College". This means that the index of our Series is
sorted alphabetically by "College" names. Of the
"College" names mentioned in the data description
("ERC", "Marshall", "Muir",
"Revelle", "Seventh", "Sixth",
and "Warren"), the first name alphabetically is
"ERC", so using .index[0] on the above index
gives us "ERC".
The average score on this problem was 32%.
Consider again the expression from 1.5. Suppose we remove the piece
.sort_values(by="Class Standing")but keep all other parts the same. Does this change the value the expression evaluates to?
Yes, this changes the value the expression evaluates to.
No, this does not change the value the expression evaluates to.
Answer: No, this does not change the value the expression evaluates to.
We addressed this in the second subpart of the problem: “Note
that if we didn’t sort before grouping – that is, if our expression was
just survey.groupby("College").count() – the resulting
DataFrame would be the same! That’s because the order of the rows in
survey does not impact the number of rows in
survey that belong to each
"College".”
The average score on this problem was 80%.
What value does the following expression evaluate to? If you believe the expression errors, provide a one sentence explanation of why.
For example, if you think the expression evaluates to an int, don’t
write “int” or “the largest value in the "IG Followers"
column”, write the specific int, like “23”.
Hint: You have enough information to answer the problem; don’t forget to look at the data description page.
(survey
 .sort_values(by="Class Standing")
 .groupby("College").count()
 .get("IG Followers")
 .loc[0]
)Answer: The code produces an error because, after
the grouping operation, the resulting Series uses the unique college
names as indices, and there isn’t a college named 0.
In the previous few subparts, we’ve established that
survey
.sort_values(by="Class Standing")
.groupby("College").count()
.get("IG Followers")
is a Series, indexed by "College", whose values contain
the number of rows in
survey.sort_values(by="Class Standing") for each
"College".
The .loc accessor is used to extract a value from a
Series given its label, or index value. However, since the index values
in the aforementioned Series are "College" names, there is
no value whose index is 0, so this throws an error.
The average score on this problem was 54%.
Fill in the blanks below so that the expression evaluates to the most unread emails of any student that has 0 Instagram followers.
survey[__(a)__].__(b)__What goes in blank (a)?
Answer:
survey.get("IG Followers") == 0
survey.get("IG Followers") is a Series containing the
values in the "IG Followers" column.
survey.get("IG Followers") == 0, then, is a Series of
Trues and Falses, containing True
for rows where the number of "IG Followers" is 0 and
False for all other rows.
Put together, survey[survey.get("IG Followers") == 0]
evaluates to a new DataFrame, which only has the rows in
survey where the student’s number of
"IG Followers" is 0.
The average score on this problem was 89%.
What goes in blank (b)? Select all valid answers.
get("Unread Emails").apply(max)
get("Unread Emails").max()
sort_values("Unread Emails", ascending=False).get("Unread Emails").iloc[0]
sort_values("Unread Emails", ascending=False).get("Unread Emails").iloc[-1]
None of the above
Answer: Options 2 and 3
Let’s look at each option.
get("Unread Emails").apply(max) This option is invalid
because .apply(max) will produce a new Series containing
the maximums of each individual element in "Unread Emails"
rather than the maximum of the entire column. Since the values in the
"Unread Emails" columns are numbers, this will try to call
max on a number individually (many times), and that errors,
since e.g. max(2) is invalid.get("Unread Emails").max()
This option is valid because it directly fetches the
"Unread Emails" column and uses the max method
to retrieve the highest value within it, aligning with the goal of
identifying the most unread emails.sort_values("Unread Emails", ascending=False).get("Unread Emails").iloc[0]
This option is valid. The
sort_values("Unread Emails", ascending=False) method call
sorts the "Unread Emails" column in descending order.
Following this, .get("Unread Emails") retrieves the sorted
column, and .iloc[0] selects the first element, which,
given the sorting, represents the maximum number of unread emails.sort_values("Unread Emails", ascending=False).get("Unread Emails").iloc[-1]
This option is invalid because, although it sorts the
"Unread Emails" column in descending order, it selects the
last element with .iloc[-1], which represents the smallest
number of unread emails due to the descending sort order.
The average score on this problem was 89%.
Now, consider the following block of code.
temp = survey.groupby(["IG Followers", "College"]).max().reset_index()
revellian = temp[__(c)__].get("Unread Emails").__(d)__
Fill in the blanks below so that revellian is equal to
the most unread emails of any student in Revelle, among those with 0
Instagram followers.
What goes in blank (c)?
Answers:
(temp.get("College") == "Revelle") & (temp.get("IG Followers") == 0)
To identify the students in "Revelle" with
0 Instagram followers, we filter the temp
DataFrame using two conditions: (temp["IG Followers"] == 0)
ensures students have no Instagram followers, and
(temp["College"] == "Revelle") ensures the student is from
"Revelle". The & operator combines these
conditions, resulting in a subset of students from
"Revelle" with 0 Instagram followers.
The average score on this problem was 54%.
What goes in blank (d)?
Answer: iloc[0], iloc[-1],
sum(), max(), mean(), or any
other method that when called on a Series with a single value outputs
that same value
To create temp, we grouped on both
"IG Followers" and "College" and used the
max aggregation method. This means that temp
has exactly one row where "College" is
"Revelle" and "IG Followers" is 0, since when
we group on both "IG Followers" and "College",
the resulting DataFrame has exactly one row for every unique combination
of "IG Followers" and "College" name. We’ve
already identified that before blank (d) is
temp[(temp.get("College") == "Revelle") & (temp.get("IG Followers") == 0)].get("Unread Emails")Since
temp[(temp.get("College") == "Revelle") & (temp.get("IG Followers") == 0)]
is a DataFrame with just a single row, the entire expression is a Series
with just a single value, being the maximum value we ever saw in the
"Unread Emails" column when "College" was
"Revelle" and "IG Followers" was 0. To extract
the one element out of a Series that only has one element, we can use
many aggregation methods (max, min,
mean, median) or use .iloc[0] or
.iloc[-1].
The average score on this problem was 79%.
The student in Revelle with the most unread emails, among those with
0 Instagram followers, is a "HI25" (History) major. Is the
value "HI25" guaranteed to appear at least once within
temp.get("Major")?
Yes
No
Answer: No
When the survey DataFrame is grouped by both
"IG Followers" and "College" using the
.max aggregation method, it retrieves the maximum value for
each column based on alphabetical order. Even if a student in
"Revelle" with 0 Instagram followers has the most unread
emails and is a "HI25" major, the "HI25" value
would only be the maximum for the "Major" column if no
other major code in the same group alphabetically surpasses it.
Therefore, if there’s another major code like "HI26" or
"MA30" in that group, it would be chosen as the maximum
instead of "HI25".
The average score on this problem was 59%.
Currently, the "Section" column of survey
contains the values "A" and "B". However, it’s
more natural to think of the lecture sections in terms of their times,
i.e. "12PM" and "1PM".
Below, we’ve defined four functions, named converter_1,
converter_2, converter_3, and
converter_4. All four functions return "12PM"
when "A" is the argument passed in and return
"1PM" when "B" is the argument passed in.
Where they potentially differ is in how they behave when called on
arguments other than "A" and "B".
Note: In the answer choices below, by None we mean that
the function call doesn’t return anything, but doesn’t error either.
Consider the function converter_1, defined below.
    def converter_1(section):
        if section == "A":
            return "12PM"
        else:
            return "1PM"
When convert_1 is called on an argument other than
"A" or "B", what does it return?
"12PM"
"1PM"
None
It errors
Consider the function converter_2, defined below.
    def converter_2(section):
        time_dict = {
            "A": "12PM",
            "B": "1PM"
        }
        return times_dict[section]
When convert_2 is called on an argument other than
"A" or "B", what does it return?
"12PM"
"1PM"
None
It errors
Consider the function converter_3, defined below.
    def converter_3(section):
        if section == "A":
            return "12PM"
        elif section == "B":
            return "1PM"
        else:
            return 1 / 0
When converter_3 is called on an argument other than "A"
or "B", what does it return?
"12PM"
"1PM"
None
It errors
Consider the function converter_4, defined below.
    def converter_4(section):
        sections = ["A", "B"]
        times = ["12PM", "1PM"]
        for i in np.arange(len(sections)):
            if section == sections[i]:
                return times[i]
When converter_4 is called on an argument other than
"A" or "B", what does it return?
"12PM"
"1PM"
None
It errors
Answer: converter_1:
"1PM", converter_2: It errors,
converter_3: It errors, converter_4:
None.
converter_1: "1PM". The function
converter_1 checks if the input section is
equal to "A". If it is, the function returns
"12PM". However, if the input is anything other than
"A" (including values other than "B"), the
function defaults to the else condition and returns
"1PM". So, even for arguments other than "A"
or "B", converter_1 will return
"1PM".
The average score on this problem was 90%.
converter_2: It errors. The function
converter_2 utilizes a dictionary (time_dict)
to map section values to their corresponding times. When a key that
doesn’t exist in the dictionary is accessed (anything other than
"A" or "B"), a KeyError is raised, causing the
function to error.
The average score on this problem was 62%.
converter_3: It errors. The function
converter_3 specifically checks if the input section is
"A" or "B". If the input is neither
"A" nor "B", the function defaults to the else
condition where it tries to divide 1 by 0.
This operation will cause a ZeroDivisionError, leading the function to
error.
The average score on this problem was 90%.
converter_4: None. The function
converter_4 uses two lists, sections and
times, to map the section letters "A" and
"B" to their corresponding times "12PM" and
"1PM". The function then employs a for-loop to
traverse through the sections list. The expression
range(len(sections)) is used to generate a sequence of
indices for this list; since len(sections) is 2,
np.arange(len(sections)) is the array
np.array([0, 1]). Then, - Inside the loop, the condition if
section == sections[i] checks if the input section matches
the section at the current index i of the
sections list. If a match is found, the function returns
the corresponding time from the times list using
return times[i]. - However, if the function traverses the
entire sections list without finding a match (i.e., the
input is neither "A" nor "B"), no
return statement is executed. In Python, if a function
completes its execution without encountering a return
statement, it implicitly returns the value None. Hence, for
inputs other than "A" or "B",
converter_4 will return None.
The average score on this problem was 77%.
Suppose we decide to use converter_4 to convert the
values in the "Section" column of survey to
times. To do so, we first use the .apply method, like
so:
section_times = survey.get("Section").apply(converter_4)What is the type of section_times?
int or float
Boolean
string
list or array
Series
DataFrame
We’d then like to replace the "Section" column in
survey with the results in section_times. To
do so, we run the following line of code, after running the assignment
statement above:
survey.assign(Section="section_times")What is the result of running the above line of code?
The "Section" column in survey now contains
only the values "12PM" and "1PM".
The line evaluates to a new DataFrame whose "Section"
column only contains the values "12PM" and
"1PM", but the "Section" column in
survey still contains the values "A" and
"B".
An error is raised, because we can’t use .assign with a
column name that already exists.
An error is raised, because the value after the = needs
to be a list, array, or Series, not a string.
An error is raised, because the value before the = needs
to be a string, not a variable name.
Answer:
What is the type of section_times?
Series. When the .apply() method is used on a
Series in a DataFrame, it applies the given function to each element in
the Series and returns a new Series with the transformed values. Thus,
the type of section_times is a Series.
The average score on this problem was 76%.
What is the result of running the above line of code? An
error is raised, because the value after the = needs to be
a list, array, or Series, not a string. The
.assign method is used to add new columns or modify
existing columns in a DataFrame. The correct usage would have been to
provide the actual Series section_times without quotes. The
provided line mistakenly provides a string "section_times"
instead of the actual variable, leading to an error.
The average score on this problem was 52%.
Consider the following block of code.
    A = survey.shape[0]
    B = survey.groupby(["Unread Emails", "IG Followers"]).count().shape[0]
Suppose the expression A == B evaluates to
True. Given this fact, what can we conclude?
There are no two students in the class with the same number of unread emails.
There are no two students in the class with the same number of Instagram followers.
There are no two students in the class with the same number of Instagram followers, and there are no two students in the class with the same number of unread emails.
There are no two students in the class with both the same number of unread emails and the same number of Instagram followers.
Answer: There are no two students in the class with both the same number of unread emails and the same number of Instagram followers.
The DataFrame
survey.groupby(["Unread Emails", "IG Followers"]).count()
will have one row for every unique combination of
"Unread Emails" and "IG Followers". If two
students had the same number of "Unread Emails" and
"IG Followers", they would be grouped together, resulting
in fewer groups than the total number of students. But since
A == B, it indicates that there are as many unique
combinations of these two columns as there are rows in the
survey DataFrame. Thus, no two students share the same
combination of "Unread Emails" and
"IG Followers".
Note that if student X has 2 "Unread Emails" and 5
"IG Followers", student Y has 2
"Unread Emails" and 3 "IG Followers", and
student Z has 3 "Unread Emails" and 5
"IG Followers", they all have different combinations of
"Unread Emails" and "IG Followers", meaning
that they’d all be represented by different rows in
survey.groupby(["Unread Emails", "IG Followers"]).count().
This is despite the fact that some of their numbers of
"Unread Emails" and "IG Followers" are not
unique.
The average score on this problem was 72%.
We’d like to find the mean number of Instagram followers of all students in DSC 10. One correct way to do so is given below.
mean_1 = survey.get("IG Followers").mean()Another two possible ways to do this are given below.
    # Possible method 1.
    mean_2 = survey.groupby("Section").mean().get("IG Followers").mean()

    # Possible method 2.
    X = survey.groupby("Section").sum().get("IG Followers").sum()
    Y = survey.groupby("Section").count().get("IG Followers").sum()
    mean_3 = X / Y
Is mean_2 equal to mean_1?
Yes.
Yes, if both sections have the same number of students, otherwise maybe.
Yes, if both sections have the same number of students, otherwise no.
No.
Is mean_3 equal to mean_1?
Yes.
Yes, if both sections have the same number of students, otherwise maybe.
Yes, if both sections have the same number of students, otherwise no.
No.
Answer:
Is mean_2 is equal to mean_1? Yes,
if both sections have the same number of students, otherwise
maybe.
mean_2 is the “mean of means” – it finds the mean number
of "IG Followers" for each section, then finds the mean of
those two numbers. This is not in general to the overall mean, because
it doesn’t consider the fact that Section A may have more students than
Section B (or vice versa); if this is the case, then Section A needs to
be weighted more heavily in the calculation of the overall mean.
Let’s look at a few examples to illustrate our point. - Suppose
Section A has 2 students who both have 10 followers, and Section B has 1
student who has 5 followers. The overall mean number of followers is
\frac{10 + 10 + 5}{3} = 8.33.., while
the mean of the means is \frac{10 + 5}{2} =
7.5. These are not the same number, so mean_2 is not
always equal to mean_1. We can rule out “Yes” as an option.
- Suppose Section A has 2 students where one has 5 followers and one has
7, and Section B has 2 students where one has 3 followers and one has 15
followers. Then, the overall mean is \frac{5 +
7 + 3 + 13}{4} = \frac{28}{4} = 7, while the mean of the means is
\frac{\frac{5+7}{2} + \frac{3 + 13}{2}}{2} =
\frac{6 + 8}{2} = 7. If you experiment (or even write out a full
proof), you’ll note that as long as Sections A and B have the same
number of students, the overall mean number of followers across their
two sections is equal to the mean of their section-specific mean numbers
of followers. We can rule out “No” as an option. - Suppose Section A has
2 students who both have 10 followers, and Section B has 3 students who
both have 10 followers. Then, the overall mean is 10, and so is the mean
of means. So, it’s possible for there to be a different number of
students in Sections A and B and for mean_2 to be equal to
mean_1. It’s not always, true, though, which is why the
answer is “Yes, if both sections have the same number of students,
otherwise maybe” and we can rule out the “otherwise no” case.
The average score on this problem was 15%.
Is mean_3 is equal to mean_1?
Yes.
Let’s break down the calculations:
X:
survey.groupby("Section").sum().get("IG Followers")
calculates the total number of followers for each section separately.
The subsequent .sum() then adds these totals together,
providing the total number of followers in the entire class.Y:
survey.groupby("Section").count().get("IG Followers")
counts the number of students in each section. The subsequent
.sum() then aggregates these counts, giving the total
number of students in the entire class.Then, mean_3 = X / Y divides the total number of
Instagram followers by the total number of students to get the overall
average number of followers per student for the entire dataset. This is
precisely how mean_1 is calculated. Hence,
mean_3 and mean_1 will always be equal, so the
answer is “Yes.”
The average score on this problem was 58%.
Teresa and Sophia are bored while waiting in line at Bistro and decide to start flipping a UCSD-themed coin, with a picture of King Triton’s face as the heads side and a picture of his mermaid-like tail as the tails side.

Teresa flips the coin 21 times and sees 13 heads and 8 tails. She
stores this information in a DataFrame named teresa that
has 21 rows and 2 columns, such that:
The "flips" column contains "Heads" 13
times and "Tails" 8 times.
The "Wolftown" column contains "Teresa"
21 times.
Then, Sophia flips the coin 11 times and sees 4 heads and 7 tails.
She stores this information in a DataFrame named sophia
that has 11 rows and 2 columns, such that:
The "flips" column contains "Heads" 4
times and "Tails" 7 times.
The "Makai" column contains "Sophia" 11
times.
How many rows are in the following DataFrame? Give your answer as an integer.
teresa.merge(sophia, on="flips")Hint: The answer is less than 200.
Answer: 108
Since we used the argument on="flips, rows from
teresa and sophia will be combined whenever
they have matching values in their "flips" columns.
For the teresa DataFrame:
"Heads" in the
"flips" column."Tails" in the
"flips" column.For the sophia DataFrame:
"Heads" in the
"flips" column."Tails" in the
"flips" column.The merged DataFrame will also only have the values
"Heads" and "Tails" in its
"flips" column. - The 13 "Heads" rows from
teresa will each pair with the 4 "Heads" rows
from sophia. This results in 13
\cdot 4 = 52 rows with "Heads" - The 8
"Tails" rows from teresa will each pair with
the 7 "Tails" rows from sophia. This results
in 8 \cdot 7 = 56 rows with
"Tails".
Then, the total number of rows in the merged DataFrame is 52 + 56 = 108.
The average score on this problem was 54%.
Let A be your answer to the previous part. Now, suppose that:
teresa contains an additional row, whose
"flips" value is "Total" and whose
"Wolftown" value is 21.
sophia contains an additional row, whose
"flips" value is "Total" and whose
"Makai" value is 11.
Suppose we again merge teresa and sophia on
the "flips" column. In terms of A, how many rows are in the new merged
DataFrame?
A
A+1
A+2
A+4
A+231
Answer: A+1
The additional row in each DataFrame has a unique
"flips" value of "Total". When we merge on the
"flips" column, this unique value will only create a single
new row in the merged DataFrame, as it pairs the "Total"
from teresa with the "Total" from
sophia. The rest of the rows are the same as in the
previous merge, and as such, they will contribute the same number of
rows, A, to the merged DataFrame. Thus,
the total number of rows in the new merged DataFrame will be A (from the original matching rows) plus 1
(from the new "Total" rows), which sums up to A+1.
The average score on this problem was 46%.
The histogram below displays the distribution of the number of Instagram followers each student has, measured in 100s. That is, if a student is represented in the first bin, they have between 0 and 200 Instagram followers.
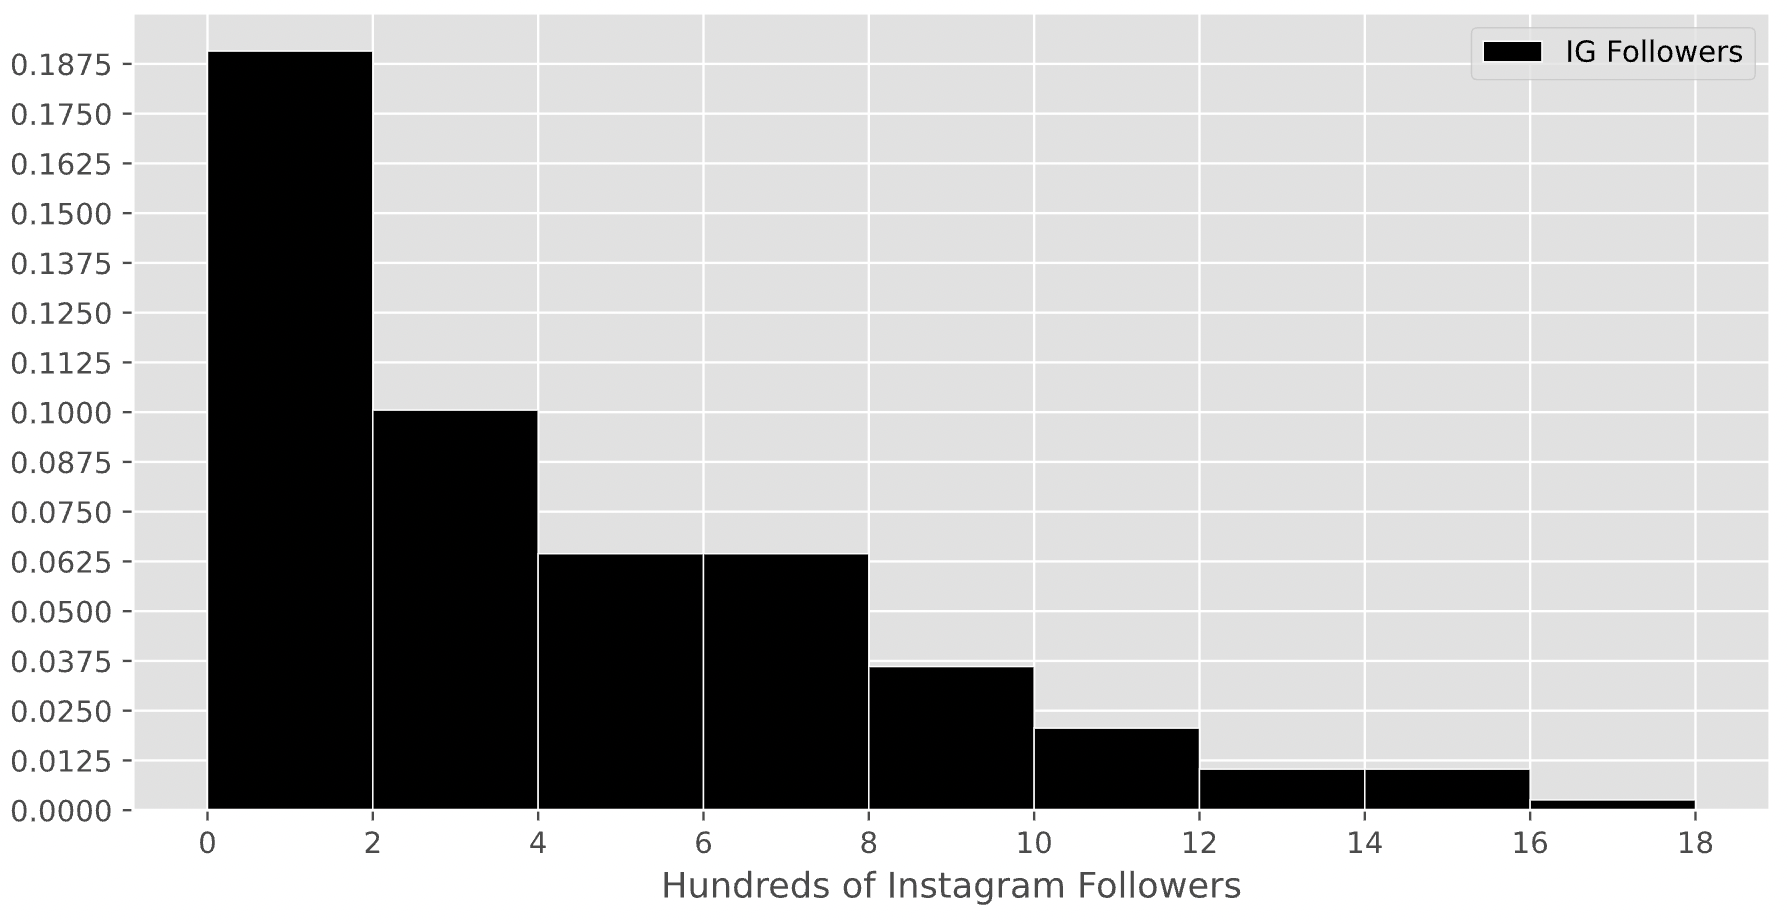
For this question only, assume that there are exactly 200 students in DSC 10.
How many students in DSC 10 have between 200 and 800 Instagram followers? Give your answer as an integer.
Answer: 90
Remember, the key property of histograms is that the proportion of values in a bin is equal to the area of the corresponding bar. To find the number of values in the range 2-8 (the x-axis is measured in hundreds), we’ll need to find the proportion of values in the range 2-8 and multiply that by 200, which is the total number of students in DSC 10. To find the proportion of values in the range 2-8, we’ll need to find the areas of the 2-4, 4-6, and 6-8 bars.
Area of the 2-4 bar: \text{width} \cdot \text{height} = 2 \cdot 0.1 = 0.2
Area of the 4-6 bar: \text{width} \cdot \text{height} = 2 \cdot 0.0625 = 0.125.
Area of the 6-8 bar: \text{width} \cdot \text{height} = 2 \cdot 0.0625 = 0.125.
Then, the total proportion of values in the range 2-8 is 0.2 + 0.125 + 0.125 = 0.45, so the total number of students with between 200 and 800 Instagram followers is 0.45 \cdot 200 = 90.
The average score on this problem was 49%.
Suppose the height of a bar in the above histogram is h. How many students are represented in the corresponding bin, in terms of h?
Hint: Just as in the first subpart, you’ll need to use the assumption from the start of the problem.
20 \cdot h
100 \cdot h
200 \cdot h
400 \cdot h
800 \cdot h
Answer: 400 \cdot h
As we said at the start of the last solution, the key property of histograms is that the proportion of values in a bin is equal to the area of the corresponding bar. Then, the number of students represented by a bar is the total number of students in DSC 10 (200) multiplied by the area of the bar.
Since all bars in this histogram have a width of 2, the area of a bar in this histogram is \text{width} \cdot \text{height} = 2 \cdot h. If there are 200 students in total, then the number of students represented in a bar with height h is 200 \cdot 2 \cdot h = 400 \cdot h.
To verify our answer, we can check to see if it makes sense in the context of the previous subpart. The 2-4 bin has a height of 0.1, and 400 \cdot 0.1 = 40. The total number of students in the range 2-8 was 90, so it makes sense that 40 of them came from the 2-4 bar, since the 2-4 bar takes up about half of the area of the 2-8 range.
The average score on this problem was 36%.
The four most common majors among students in DSC 10 this quarter are
"MA30" (Mathematics - Computer Science),
"EN30" (Business Economics), "EN25"
(Economics), and "CG35" (Cognitive Science with a
Specialization in Machine Learning and Neural Computation). We’ll call
these four majors “popular majors".
There are 80 students in DSC 10 with a popular major. The distribution of popular majors is given in the bar chart below.
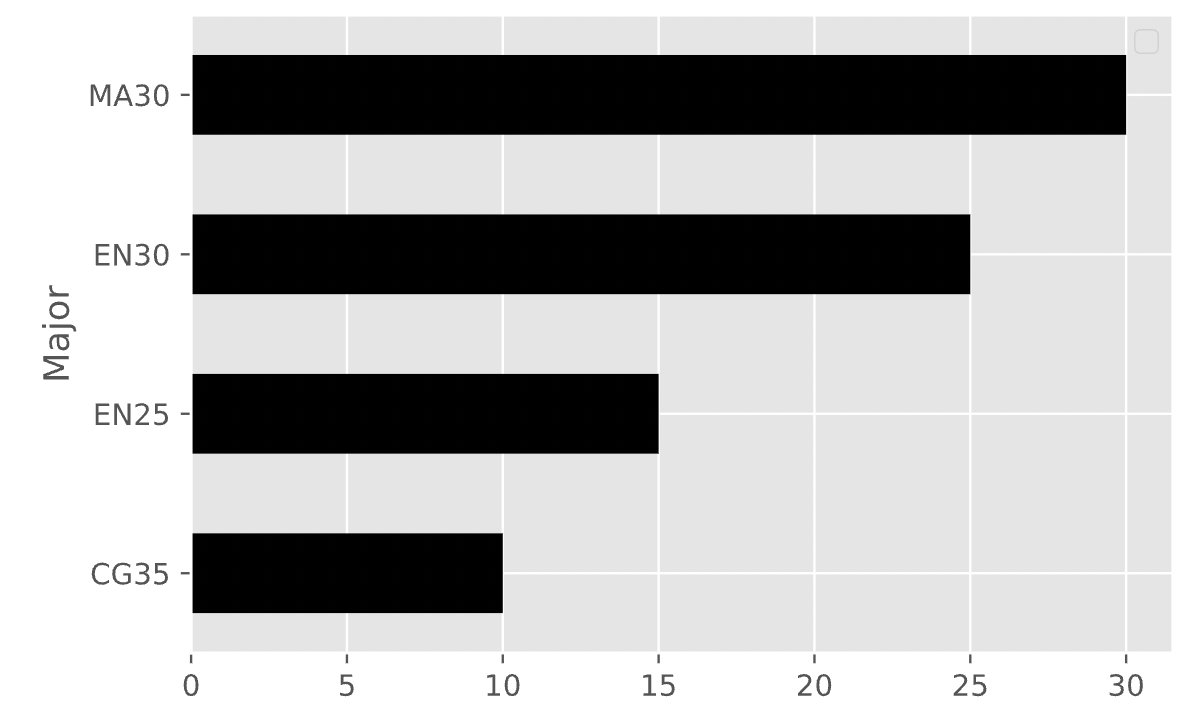
Fill in the blank below so that the expression outputs the bar chart above.
    (survey
     .groupby("Major").count()
     .sort_values("College")
     .take(____)
     .get("Section")
     .plot(kind="barh")
    )
What goes in the blank?
Answer: [-4, -3. -2, -1]
Let’s break down the code line by line:
.groupby("Major") will group the survey DataFrame by
the "Major" column..count() will count the number of students in each
major..sort_values("College") sort these counts in ascending
order using the "College" column (which now contains
counts)..take([-4, -3. -2, -1]) will take the last 4 rows of
the DataFrame, which will correspond to the 4 most common majors..get("Section") get the "Section" column,
which also contains counts..plot(kind="barh") will plot these counts in a
horizontal bar chart.The argument we give to take is
[-4, -3, -2, -1], because that will give us back a
DataFrame corresponding to the counts of the 4 most common majors, with
the most common major ("MA30") at the bottom. We want the
most common major at the bottom of the Series that
.plot(kind="barh") is called on because the bottom row will
correspond to the top bar – remember, kind="barh" plots one
bar per row, but in reverse order.
The average score on this problem was 4%.
Suppose we select two students in popular majors at
random with replacement. What is the probability that both have
"EN" in their major code? Give your answer in the form of a
simplified fraction.
Answer: \frac{1}{4}
"EN" in their major code is
the sum of "EN30" and "EN25" students: 25 + 15 = 40The probability that a single student chosen at random from the
popular majors has "EN" in their major code is number of
"EN" majors divided by total number of popular majors.
P(\text{one has ``EN"}) = \frac{40}{80} = \frac{1}{2}
Since the students are chosen with replacement, the probabilities
remain consistent for each draw. So the probability that both randomly
chosen students (with replacement) have "EN" in their major
code is
P(\text{both have ``EN"}) = P(\text{one has ``EN"}) \cdot P(\text{one has ``EN"}) = \frac{1}{2} \cdot \frac{1}{2} = \frac{1}{4}
The average score on this problem was 61%.
Suppose we select two students in popular majors at
random with replacement. What is the probability that we select one
"CG35" major and one "MA30" major (in any
order)?
\frac{1}{2}
\frac{3}{4}
\frac{3}{8}
\frac{3}{16}
\frac{3}{32}
\frac{3}{64}
Answer: \frac{3}{32}
"CG35" major first and
then one "MA30" major is: \frac{10}{80} \cdot \frac{30}{80} = \frac{1}{8} \cdot \frac{3}{8} = \frac{3}{64}"MA30" major first and
then one "CG35" major is: \frac{30}{80} \cdot \frac{10}{80} = \frac{3}{8} \cdot \frac{1}{8} = \frac{3}{64}Since the two events are mutually exclusive (they cannot both
happen), we sum their probabilities to get the combined probability of
the event occurring in any order:
P(\text{one ``CG35" and one
``MA30"}) = P(\text{``CG35" then ``MA30" OR ``MA30"
then ``CG35"}) = P(\text{``CG35 then ``MA30"}) +
P(\text{``MA30" then ``CG35"}) = \frac{3}{64} + \frac{3}{64} =
\frac{6}{64} = \frac{3}{32}
The average score on this problem was 18%.
Suppose we select k
students in popular majors at random with replacement. What is the
probability that we select at least one "CG35" major?
\frac{7}{8}
\frac{7^k}{8^k}
\frac{1}{7^k}
\frac{1}{8^k}
\frac{8^k - 7^k}{7^k}
\frac{8^k - 7^k}{8^k}
Answer: \frac{8^k - 7^k}{8^k}
Of the 80 students in popular majors, 10 are in "CG35".
To determine the likelihood of selecting at least one
"CG35" major out of k random draws with replacement, we
first find the probability of not drawing a "CG35" major in
all k attempts by
following the steps below:
The probability of not selecting a "CG35" major in
one draw is 1 - \frac{10}{80} = 1 - \frac{1}{8} = \frac{7}{8}
The probability of not selecting a "CG35" major in
k draws is, then,
\frac{7^k}{8^k}, since each draw is
independent.
Now, by subtracting this probability from 1, we get the probability
of drawing at least one "CG35" major in those k attempts. So, the probability of
selecting at least one "CG35" major in k attempts is 1 - \frac{7^k}{8^k} = \frac{8^k}{8^k} -
\frac{7^k}{8^k} = \frac{8^k - 7^k}{8^k}
The average score on this problem was 58%.
We’d like to select three students at random from the entire class to win extra credit (not really). When doing so, we want to guarantee that the same student cannot be selected twice, since it wouldn’t really be fair to give a student double extra credit.
Fill in the blanks below so that prob_all_unique is an
estimate of the probability that all three students selected are in
different majors.
Hint: The function np.unique, when called on an
array, returns an array with just one copy of each unique element in the
input. For example, if vals contains the values
1, 2, 2, 3, 3, 4, np.unique(vals) contains the
values 1, 2, 3, 4.
    unique_majors = np.array([])
    for i in np.arange(10000):
        group = np.random.choice(survey.get("Major"), 3, __(a)__)
        __(b)__ = np.append(unique_majors, len(__(c)__))

prob_all_unique = __(d)__What goes in blank (a)?
replace=True
replace=False
Answer: replace=False
Since we want to guarantee that the same student cannot be selected twice, we should sample without replacement.
The average score on this problem was 77%.
What goes in blank (b)?
Answer: unique_majors
unique_majors is the array we initialized before running
our for-loop to keep track of our results. We’re already
given that the first argument to np.append is
unique_majors, meaning that in each iteration of the
for-loop we’re creating a new array by adding a new element
to the end of unique_majors; to save this new array, we
need to re-assign it to unique_majors.
The average score on this problem was 65%.
What goes in blank (c)?
Answer: np.unique(group)
In each iteration of our for-loop, we’re interested in
finding the number of unique majors among the 3 students who were
selected. We can tell that this is what we’re meant to store in
unique_majors by looking at the options in the next
subpart, which involve checking the proportion of times that the values
in unique_majors are 3.
The majors of the 3 randomly selected students are stored in
group, and np.unique(group) is an array with
the unique values in group. Then,
len(np.unique(group)) is the number of unique majors in the
group of 3 students selected.
The average score on this problem was 45%.
What could go in blank (d)? Select all that apply. At least one option is correct; blank answers will receive no credit.
(unique_majors > 2).mean()
(unique_majors.sum() > 2).mean()
np.count_nonzero(unique_majors > 2).sum() / len(unique_majors > 2)
1 - np.count_nonzero(unique_majors != 3).mean()
unique_majors.mean() - 3 == 0
Answer: Option 1 only
Let’s break down the code we have so far:
unique_majors is initialized to
store the number of unique majors in each iteration of the
simulation.np.unique function is
employed to identify the number of unique majors among the selected
three. The result is then appended to the unique_majors
array.unique_majors array contains a value greater than 2.Let’s look at each option more carefully.
(unique_majors > 2).mean() will create a Boolean array
where each value in unique_majors is checked if it’s
greater than 2. In other words, it’ll return True for each
3 and False otherwise. Taking the mean of this Boolean
array will give the proportion of True values, which
corresponds to the probability that all 3 students selected are in
different majors.(unique_majors.sum() > 2)
will generate a single Boolean value (either True or
False) since you’re summing up all values in the
unique_majors array and then checking if the sum is greater
than 2. This is not what you want. .mean() on a single
Boolean value will raise an error because you can’t compute the mean of
a single Boolean.np.count_nonzero(unique_majors > 2).sum() / len(unique_majors > 2)
would work without the .sum().
unique_majors > 2 results in a Boolean array where each
value is True if the respective simulation yielded 3 unique
majors and False otherwise. np.count_nonzero()
counts the number of True values in the array, which
corresponds to the number of simulations where all 3 students had unique
majors. This returns a single integer value representing the count. The
.sum() method is meant for collections (like arrays or
lists) to sum their elements. Since np.count_nonzero
returns a single integer, calling .sum() on it will result
in an AttributeError because individual numbers do not have a sum
method. len(unique_majors > 2) calculates the length of
the Boolean array, which is equal to 10,000 (the total number of
simulations). Because of the attempt to call .sum() on an
integer value, the code will raise an error and won’t produce the
desired result.np.count_nonzero(unique_majors != 3) counts the number of
trials where not all 3 students had different majors. When you call
.mean() on an integer value, which is what
np.count_nonzero returns, it’s going to raise an
error.unique_majors.mean() - 3 == 0 is trying to check if the
mean of unique_majors is 3. This line of code will return
True or False, and this isn’t the right
approach for calculating the estimated probability.
The average score on this problem was 56%.