← return to practice.dsc10.com
This quiz was administered in-person. It was closed-book and
closed-note; students were not allowed to use the DSC
10 Reference Sheet. Students had 20 minutes to work on
the quiz.
This quiz covered Lectures 5-9 of the Spring 2024 offering
of DSC 10.
An art museum records information about its collection in a DataFrame
called art. The columns of art are as
follows:
"title" (str): the name of the art piece."artist" (str): the name of the artist."year" (int): the year the art piece was produced."price" (float): the selling price of the art piece in
dollarsWrite an expression that evaluates to the number of art pieces made in 1950 that cost less than $10,000.
Answer:
art[(art.get("year") == 1950) & (art.get("price") < 10000)].shape[0]
The average score on this problem was 72%.
Fill in the blanks in the code below to find the name of the artist
in art who has the lowest mean price of art pieces.
art.groupby(___(x)___).___(y)___.sort_values(by="price").index[0]Answer: (x): "artist", (y):
mean()
The average score on this problem was 94%.
Fill in the blanks in the code below to find the name of the artist
in art who made the most art pieces in a single year.
(art.groupby(___(x)___).___(y)___.reset_index()
        .sort_values(by="title", ascending=False)
.get("artist").iloc[0])Answer: (x):
["artist", "year"] or ["year", "artist"], (y):
count()
The average score on this problem was 59%.
Which of the following correctly plots a density histogram showing
the distribution of "price" in art? Select all
that apply.
art.get(["price"]).plot(kind="hist", density=True)
art.get(["price"]).plot(kind="hist")
art.drop(columns=["artist", "year", "price"]).plot(kind="hist", density=True)
art.plot(kind="hist", y="price")
art.plot(kind="hist", y="price", density=True)
art.plot(kind="hist", x="price", density=True)
Answer: Options 1 and 5
The average score on this problem was 83%.
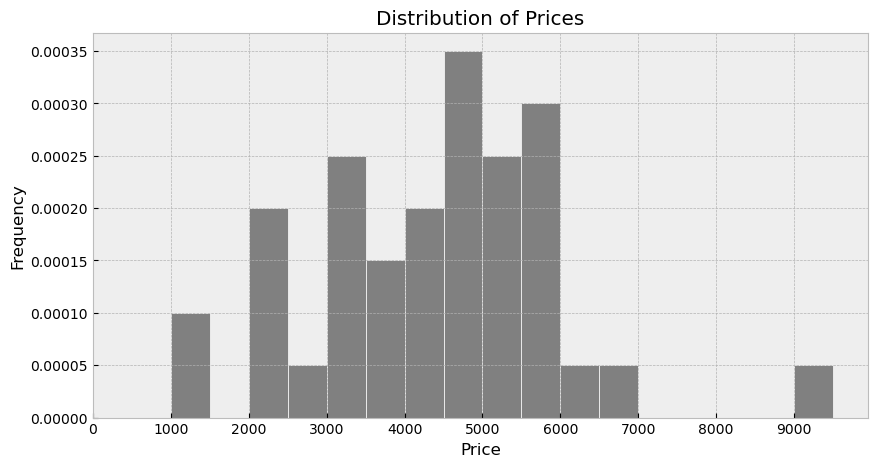
The density histogram below shows the distribution of
"price" in art. If the museum has 100 art
pieces in total, how many pieces cost at least $3,000 but less than
$4,500?

Answer: 30
The average score on this problem was 55%.
Fill in the return statement of the function
is_expensive, which takes as input the price of an art
piece (as a float, in dollars) and returns True if the
price is more than 20 million dollars. Otherwise, it returns
False.
def is_expensive(price):
return ___(a)___Answer: price > 20_000_000
The average score on this problem was 74%.
Write one line of code to add a new column called exp to
the art DataFrame, which categorizes if each art piece is
worth more than 20 million dollars, using Boolean values. You must use
the is_expensive function you wrote above. Make sure to
modify art!
Answer:
art = art.assign(exp = art.get("price").apply(is_expensive))
The average score on this problem was 73%.
Next, we make a new DataFrame called expensive as
follows.
expensive = art[art.get(exp)]
merged = art.merge(expensive, on="artist")
Van Gogh is one artist represented in art and exactly
half of his pieces in art are worth over 20 million
dollars. If Van Gogh’s art appears in 72 rows of the merged
DataFrame, how many rows does Van Gogh actually have in the original
art DataFrame?
Answer: 12
The average score on this problem was 16%.