← return to practice.dsc10.com
Instructor(s): Janine Tiefenbruck
This exam was administered in-person. Students were allowed one page of double-sided handwritten notes. No calculators were allowed. Students had 50 minutes to take this exam.
⚠️ PDF version available here .
Note (groupby / pandas 2.0): Pandas 2.0+ no longer
silently drops columns that can’t be aggregated after a
groupby, so code written for older pandas may behave
differently or raise errors. In these practice materials we use
.get() to select the column(s) we want after
.groupby(...).mean() (or other aggregations) so that our
solutions run on current pandas. On real exams you will not be penalized
for omitting .get() when the old behavior would have
produced the same answer.
One month ago today, President Donald Trump announced his plan to impose so-called “reciprocal” tariffs on goods imported into the US from other countries. Tariffs are taxes charged by a government on imported goods, at a specific percentage of the value of the goods.
At a “Liberation Day” ceremony outside the White House, Trump held up
a printed chart of countries, the tariffs they charge to the US, and the
planned reciprocal tariff on goods from that country into the US. We
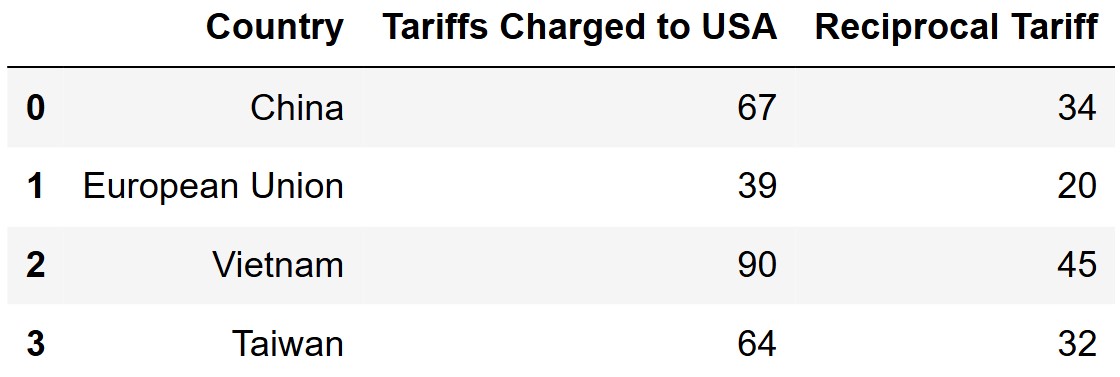
have the data from that printed chart stored in the tariffs
DataFrame, whose first few rows are shown below. tariffs
contains 50 rows in total.
Note that the "Tariffs Charged to USA" and
"Reciprocal Tariff" columns contain int values
representing percentages. For example, a \$200 product from China would be subject to
a 34\% tariff, which is a \$68 tax.
Assume that we have already run import babypandas as bpd
and import numpy as np.
Which country has the highest "Reciprocal Tariff"? Write
one line of code that evaluates to the name of this country.
Answer:
tariffs.sort_values(by="Reciprocal Tariff", ascending=False).get("Country").iloc[0]
or
tariffs.set_index("Country").sort_values(by="Reciprocal Tariff", ascending=False).index[0]
To find the country with the highest “Reciprocal Tariff”, we need to
first sort tariffs by the "Reciprocal Tariff"
column in descending order:
tariffs.sort_values(by="Reciprocal Tariff", ascending=False).
After sorting in descending order, we know that the country with the
highest reciprocal tariff will be in the first row. Then, to get the
name of this country, we select the "Country" column using
.get("Country"). This gives us a Series of countries in
order of descending reciprocal tariffs, and we can access the first
value in this Series by using .iloc[0]. Note that if we
sort in ascending order instead, we can use .iloc[-1] to
access the last value in the Series.
Alternatively, since each country appears only once in
tariffs, we can start by setting the "Country"
column as the index: tariffs.set_index("Country"). Then, we
sort the resulting DataFrame by the "Reciprocal Tariff"
column in descending order, as explained above. Since the country names
are now in the index, the first row of this sorted DataFrame will have
the country with the highest reciprocal tariff as its index value, which
we can access by using .index[0]. Note that if we sort in
ascending order instead, we can use .index[-1] to access
the last value in the index.
The average score on this problem was 71%.
How many countries have a "Reciprocal Tariff" above
30\%? Write one line of code that
evaluates to the number of such countries.
Answer:
tariffs[tariffs.get("Reciprocal Tariff")>30].shape[0]
The average score on this problem was 89%.
In tariffs, we use integers to represent percentages,
but we could also use strings with the percent symbol %. For example,
the integer 34 and the string "34%" both
represent the same thing.
Fill in the functions with_percent_symbol and
without_percent_symbol below. The function
with_percent_symbol should take as input an integer and
give as output a string with the percent symbol. The function
without_percent_symbol should do the opposite. Example
behavior is given below.
    >>>  with_percent_symbol(34)
    "34%"
    >>> without_percent_symbol("34%")
    34

    def with_percent_symbol(x):
        return __(a)__

    def without_percent_symbol(x):
return __(b)__Answer (a): str(x)+"%"
In order to add a percent symbol to the end, we first need to convert
the variable x from an integer into a string by casting it.
From there we can add a "%" sign to x through
concatenation.
The average score on this problem was 70%.
Answer (b): int(x.replace("%", "")) or
int(x.strip("%"))
In this case, the variable x is now a string with
"%" at the end of it. Our first step is to get rid of the
"%" at the end by either replacing it with an empty string
"", or stripping it from the end. Note that the
.strip("%") approach works because "%" is at
the end of the string. If it were in the middle instead of the start or
end, .strip("%") would not work. After we are left with
only the number to cast to a string value for our output.
The average score on this problem was 79%.
Define the variable y as follows.
y = tariffs.get("Reciprocal Tariff").apply(with_percent_symbol)Below, define z so that it evaluates to exactly the same
Series as y. You may not use
with_percent_symbol or y when defining
z.
Answer:
z = tariffs.get("Reciprocal Tariff").apply(str) + "%"
The Reciprocal Tariff column consists of integer values.
In order to add a percent sign (“%”) to the end of each of these values,
we must first convert the Series of integers into a Series of strings
before we are able to concatenate each with the percent sign (“%”).
The average score on this problem was 33%.
Determine the value of the following expression.
y.iloc[3] + " tax on goods from " + tariffs.get("Country").loc[3]Answer:
"32% tax on goods from Taiwan"
y.iloc[3] consists of the Reciprocal Tariff (as a
string) corresponding to the fourth entry of the Series y. From the
given DataFrame, the fourth row corresponds to a Reciprocal Tariff 32.
Because y is a Series of strings that added the “%” sign to each
Reciprocal Tariff, y.iloc[3] evaluates to the string “32%”.
tariffs.get("Country").loc[3] evaluates to the country at
the fourth position from the tariffs DataFrame, or
“Taiwan”.
The average score on this problem was 88%.
Trump’s administration set the reciprocal tariffs based on tariffs charged to the USA.
For each country in tariffs, the value in the
"Reciprocal Tariff" column is simply half of the value in
the "Tariffs Charged to USA" column, rounded
up to the next integer.
In addition, if the "Tariffs Charged to USA" is less
than 20 percent, then the
"Reciprocal Tariff" is set to 10 percent, so that no country’s reciprocal
tariff is ever less than 10
percent.
Fill in the blanks in the function reciprocate which
takes as input an integer representing the tariffs charged to the USA by
a country, and returns an integer representing the reciprocal tariff
that the US will impose on that country.
    def reciprocate(charged):
        half = int((charged + 1) / 2)
        if __(a)__:
            return __(b)__
        else:
return __(c)__Answer (a): charged < 20 or
charged <= 20 or half < 10 or
half <= 10
Answer (b): 10
Answer (c): half
The average score on this problem was 79%.
Fill in the return statement of the function
reciprocate_2 which behaves the same as
reciprocate but is implemented differently. You may
not call the reciprocate function.
    def reciprocate_2(charged):
return __(d)__Answer (d):
max(int((charged + 1)/2), 10)
The key to solving this question lies in understanding how Python’s max function works. The function takes an input called charged, adds 1 to it, and divides the result by 2, rounding down using int(). This gives a baseline number. However, since there’s a constraint that the result should never be less than 10, we use max to return the larger of the two values: either the computed number or 10. This ensures the final result is always at least 10.
The average score on this problem was 27%.
Define the variable ch as follows.
ch = tariffs.get("Tariffs Charged to USA")You want to check that reciprocate and
reciprocate_2 give the same outputs on all inputs in
ch. Write an expression that evaluates to True
if this is the case, and False otherwise.
Answer:
(ch.apply(reciprocate) == ch.apply(reciprocate_2)).sum() == 50
This question was a bit tricky! While it might seem sufficient to
check ch.apply(reciprocate) == ch.apply(reciprocate_2),
that actually returns a Series of boolean values—one for each row—rather
than a single True/False result. To properly verify that the functions
behave identically, you need to sum the True values and
compare that sum to the total number of rows in ch.
The average score on this problem was 39%.
Below is a density histogram displaying the distribution of
reciprocal tariffs for each of the 50 countries on Trump’s chart. It was
plotted with the argument
bins=[10, 11, 15, 20, 40, 50].
Note that while the European Union is actually a group of many countries, it is counted as one country here.
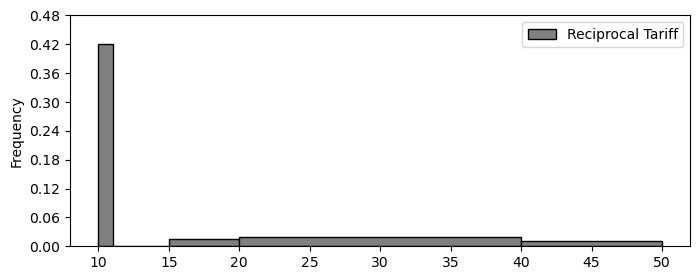
How many countries have a reciprocal tariff of 10%?
Answer: 21
Before attempting this problem, we must first understand how to interpret a density histogram. The x-axis represents the reciprocal tariff rate (in %), and the y-axis shows the density. The total area under the histogram sums to 1, with each bin corresponding to the proportion of countries falling within that bin.
The bins are defined as follows:
Countries with a reciprocal tariff of exactly 10% fall into the fist bin, [10, 11). The width of this bin is:
\text{width} = 11 - 10 = 1
Given that the height of the bin is 0.42, we calculate the area (i.e., the proportion of countries in this bin) using the formula:
\text{area} = \text{height} \times \text{width} \text{area} = .42 \times 1 \text{area} = .42
This, 42% of the countries fall within the [10, 11) range. If there are 50 countries in total, we compute the number of countries in this bin as:
50 \times .42 = 21
So, 21 countries have a reciprocal tariff rate between 10% and 11%.
The average score on this problem was 82%.
Suppose we plotted the same histogram, except we changed the
bins argument to
bins = [8, 15, 22, 30, 40, 50]. What would be the height of
the leftmost bar in this histogram? Give your answer as
a number to two decimal places.
Answer: 0.06
In this subproblem, we are told that the bins are changed. This time, instead of having a width of 1, the new bin has a width of 7 (15 - 8).
Looking back at the histogram given, we note that there is no data in the interval [11, 15); all the data within this new, wider bin comes from the previous [10, 11) bin.
We know the area is .42 as calculated in the prior subproblem, meaning all we have to do is recalculate the height using the changed width:
\text{area} = \text{height} \times \text{width} .42 = \text{height} \times 7 \frac{.42}{7} = \text{height} .06 = \text{height}
The average score on this problem was 52%.
The European Union is not actually one country, but a group of 27
countries. Imagine we were to replace the row of tariffs
corresponding to the European Union with 27 rows representing each of
the member countries (all with a 20\%
reciprocal tariff), then plot a histogram of the reciprocal tariffs
using bins = [10, 11, 15, 20, 40, 50].
Let h_{\text{new}} be the height of the rightmost bar in this histogram, and let h_{\text{old}} be the height of the rightmost bar in the original histogram shown above. Express h_{\text{new}} in terms of h_{\text{old}}.
Answer: h_{\text{new}} = \frac{50}{76} \cdot h_{\text{old}}
To solve this problem, we need to understand how modifying the dataset by replacing one row (The European Union) with 27 rows (each with a 20% reciprocal tariff) will affect the histogram: especially the rightmost bin, which is [40, 50].
In the original histograam, the number of total countries is 50. Now we can assume that the rightmost bin [40, 50] contains n countries. Since this is a density histogram, the height of a bin is given by:
\text{height} = \frac{\text{proportion of countries in bin}}{\text{width of bin}}
So, the original height of the rightmost bin is:
h_{\text{old}} = \frac{n}{50 \times 10}
Now, we change the dataset: instead of 50 countries, we now we have 76 countries (because we’re replacing 1 EU row with 27 separate rows, essentially adding 26, not 27 more entries).
The number of countries in the [40, 50] bin remains the same, in that none of the new EU entries fall into this bin (since they all have 20% tariff). However, the total number of countries increases, which affects the overall proportion.
The new height becomes: h_{\text{new}} = \frac{n}{76 \times 10}
Now, we divide the two to find h_{\text{new}} in terms of h_{\text{old}}:
\frac{h_{\text{new}}}{h_{\text{old}}} = \frac{n / (76 \times 10)}{n / (50 \times 10)} = \frac{50}{76}
\therefore h_{\text{new}} = \frac{50}{76} \cdot h_{\text{old}}
The average score on this problem was 19%.
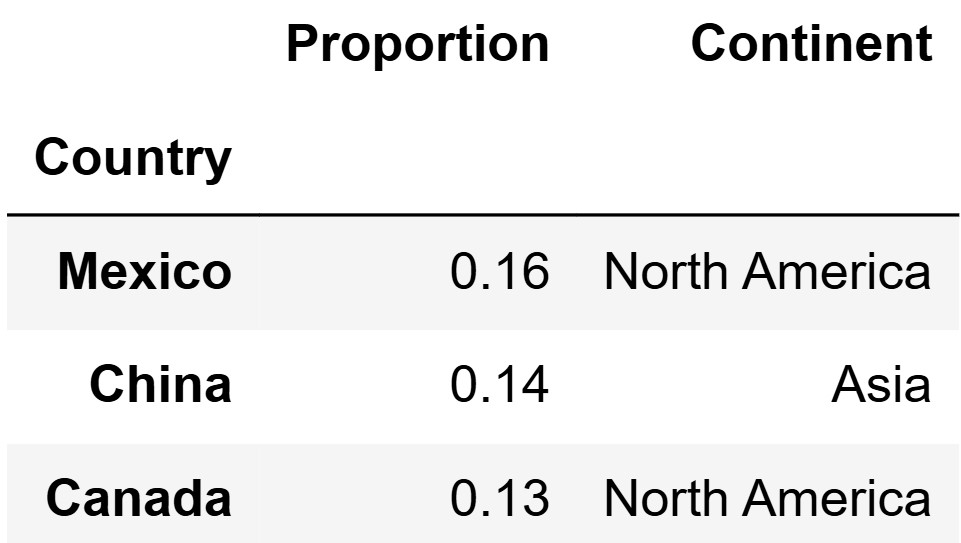
Suppose we have another DataFrame called trade_partners
that has a row for every country that the United States trades with.
trade_partners is indexed by "Country" and has
two columns:
The "Proportion" column contains floats
representing the proportion of US imports coming from each
country.
The "Continent" column contains the name of the
continent where the country is located.
All countries in tariffs are included in
trade_partners (including "European Union"),
but not all countries in trade_partners are included in
tariffs. The first three rows of
trade_partners are shown below.
Write one line of code to merge tariffs with
trade_partners and store the result in
merged.
Answer:
merged = tariffs.merge(trade_partners, left_on="Country", right_index=True)
tariffs and trade_partners are both
dataframes which correspond to the US’s relationship with other
Countries. Since both dataframes contain one row for each country we
need to merge them with the column which corresponds to the country
name. In tariffs that would be the Country
column and in trade_partners that is the index.
The average score on this problem was 80%.
How many rows does merged have?
Answer: 50
Since each DataFrame has exactly one row per country, the merged
result will also have one row for every country they share. And because
every country in tariffs appears in
trade_partners (though not vice versa), the merged
DataFrame will contain exactly as many rows as there are countries in
tariffs (which is 50).
The average score on this problem was 83%.
In which of the following DataFrames does the
"Proportion" column sum to 1? Select all that apply.
trade_partners
trade_partners.groupby("Continent").mean()
trade_partners.groupby("Continent").sum()
merged
None of the above.
Answer: trade_partners and
trade_partners.groupby("Continent").sum()
Solving this problem is best done by working through each answer
choice and eliminating the incorrect ones. In the problem statement, we
are told that the Proportion column contains floats
representing the proportion of US imports coming from each country.
Since the Proportion column contains proportions, the sum
of that column should equal one. Therefore, the first answer choice is a
correct option. Moving on to the second choice, grouping by the
continent and taking the mean proportion of each continent results in
the proportion column containing mean proportions of groups. Since we
are no longer working with all of the proportions and instead averages,
we can not guarantee the sum of the Proportion column is
one. However, because the third answer choice takes the sum of the
proportions in each Continent, all of the proportions are still
accounted for. As a result, the sum of the proportions column in the new
dataframe would still add to one. Finally, as we determined in the
previous part of the question, the merged dataframe
contains all of the rows in tariffs, but not all of the
rows in trade_partners. Per the problem description the
rows in the Proportion column of
trade_partners should sum to one, since some of those rows
are omitted in merged, it is impossible for the
Proportion column in merged to sum to one.
The average score on this problem was 88%.
Write one line of code that would produce an appropriate data visualization showing the median reciprocal tariff for each continent.
Answer:
merged.groupby("Continent").median().plot(kind="barh", y="Reciprocal Tariff");
This question calls for a visualization which shows the median
reciprocal tariff for each continent. The first part of solving this
problem involves correctly identifying what dataframe to use when
plotting the data. In this case, the problem asks for a link between
Reciprocal Tariff, a column in the tariffs
dataframe, and Continent, a column in the
trade_partners dataframe. Therefore, the
merged dataframe must be used to create the plot. Within
the merged dataframe, the question calls for median
reciprocal tariffs for each continent. Currently, the
merged dataframe has one row for each country rather than
continent. Thus, before plotting the data, the merged
dataframe must be grouped by Continent and aggregated by
the median() to get the median
Reciprocal Tariff for each continent. From there, all that
is left is plotting the data. Since there exists one categorical
variable, Continent, and one numerical variable,
Reciprocal Tariff, a bar chart is appropriate here.
Finally, because the dataframe is already indexed by continent after the
groupby statement, all that needs to be specified within the
plot function is the y variable, in this case,
Reciprocal Tariff.
The average score on this problem was 68%.
Most imported goods are transported to the US in shipping containers. The table to below shows the probability that a randomly selected shipping container comes from a given location (continent or country). Note that the probability for each continent is the sum of the probabilities for each country in that continent.
For all parts of this question, you can leave your answer as an unsimplified mathematical expression.
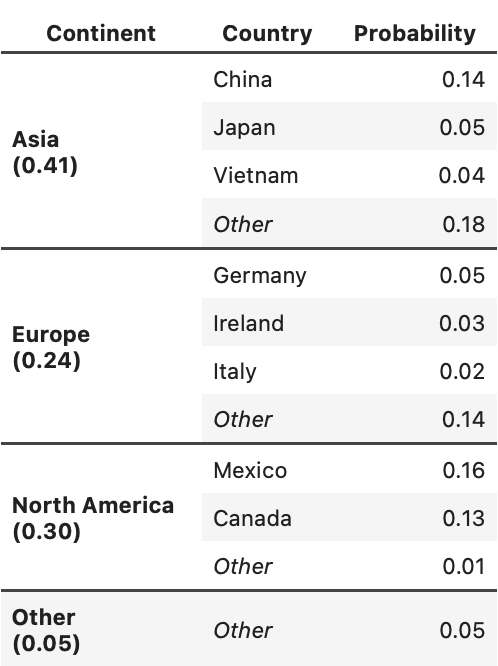
Suppose you randomly select one shipping container. You are told that it comes from Asia but not from Japan. What is the probability that it comes from China?
Answer: \frac{0.14}{0.36}=\frac{7}{18}
The average score on this problem was 53%.
True or False: Selecting a shipping container from Vietnam and selecting a shipping container from Ireland are independent events.
True
False
Answer: False
If two events A and B are independent then P(A and B) = P(A)P(B). In this question we can define A as “selecting a shipping container from Vietnam” and B as “selecting a shipping container from Ireland”. Therefore (A and B) would be “selecting a (single) shipping container from both Vietnam and Ireland”. Since that is impossible, P(A and B) = 0 while P(A)P(B) = 0.012. Therefore these two events are not independent.
The average score on this problem was 32%.
Suppose you randomly select two shipping containers, with replacement. What is the probability that exactly one comes from Germany and the other comes from somewhere in North America?
Answer: 0.03
The probability of selecting Germany as the first shipping container is 0.05. Given that Germany is selected first, the probability that the second container is from the United States is 0.3. However, since the order of the containers can be swapped, you need to multiply by 2 to account for both possible arrangements.
The average score on this problem was 46%.
Suppose you randomly select three shipping containers, with replacement. What is the probability that none of them comes from Asia?
Answer: 0.59^{3}
There are three important pieces of information to take note:
This means that we have three trials with replacement, all looking for the same outcome. Given that the probability of a shipping container is .41, we know that the complement is:
\text{Not from Asia} = 1 - .41 \text{Not from Asia} = .59
To get this outcome three times with replacement, we can do the following:
.59 \times .59 \times .59
\therefore .59^3
The average score on this problem was 42%.
The announcement of the tariffs affected many products, one of which was the Nintendo Switch 2, a new video game console. Due to the tariffs, preorders of the Nintendo Switch 2 were put on hold so pricing could be reconsidered. In this problem, we’ll imagine a scenario in which Nintendo used this delay period to drum up excitement for their new product.
Suppose Nintendo arranges a contest to give away k of
their new Switch 2 consoles. The contest is open to anyone and
n people participate, with n > k. Everyone
has an equal chance of winning, and nobody can win more than once. Jason
and Ray both enter the contest, and they want to estimate the
probability that they both win.
Fill in the blanks in the function giveaway so that it
returns an estimate of the probability that Jason and Ray both win a
Switch 2, when there are n participants and k
prizes.
    1 def giveaway(n, k):
    2     count = 0
    3     for i in np.arange(10000):
    4         winners = np.random.choice(___(a)___)
    5         if ___(b)___:
    6             count = count + 1
7 return ___(c)___Answer (a):
np.arange(n), k, replace=False
This makes sure that exactly k winners are chosen randomly from n participants without replacement, since no person can win more than once.
Answer (b):
0 in winners and 1 in winners (can be any two numbers)
Assuming Jason and Ray are represented by IDs 0 and 1, this checks
whether both of them are in the list of winners for that trial. However,
because we never specify what number Jason and Ray are, you could use
any two numbers (ie: 1 in winners and 2 in winners)
Answer (c): count/10000
This computes the estimated probability as the fraction of trials where both Jason and Ray won out of 10,000 simulations.
The average score on this problem was 32%.
If you implement giveaway correctly, what should
giveaway(100, 100) evaluate to?
Answer: 1.0
Since k is equal to n, everyone wins by default, meaning Jason and Ray will always be among the winners.
The average score on this problem was 55%.
Suppose you modify the giveaway function as follows:
Change line 2 to results = np.array([]).
Change line 6 to
results = np.append(results, "WIN!").
Leave lines 1, 3, 4, and 5 unchanged, including your code in
blanks (a) and (b).
Which of the following could be used to fill in blank
(c)? Select all that apply.
len(results)/10000
(results == "WIN!").sum()
(results == "WIN!").mean()
np.count_nonzero(results)
np.random.choice(results)
None of the above.
Answer: len(results)/10000
len(results)/10000 calculates the proportion of
trials that resulted in "WIN!", which gives the
probability.
(results == "WIN!").mean() does not work because
every entry in results is "WIN!". So this is
taking the mean of an array filled with True values, so the
mean is 1 all the time, regardless of how many times Jason
and Ray win.
(results == "WIN!").sum(): This counts the number of
“WIN!” results but does not divide by 10000, so it gives a raw count,
not a probability.
np.count_nonzero(results): This counts all non empty
entries, but since results contains only “WIN!” strings, this is just
len(results) and is equivalent to the raw count of wins, not the
probability.
np.random.choice(results): This randomly picks an
element from results. It is unrelated to calculating a
probability and makes no sense in this context.
The average score on this problem was 69%.