← return to practice.dsc10.com
This quiz was administered in-person. It was closed-book; students
were not allowed to use the DSC 10 Reference Sheet.
Students had 20 minutes to work on the
quiz.
This quiz covered Lectures 13-16 of the Spring 2025 offering
of DSC 10.
Note (groupby / pandas 2.0): Pandas 2.0+ no longer
silently drops columns that can’t be aggregated after a
groupby, so code written for older pandas may behave
differently or raise errors. In these practice materials we use
.get() to select the column(s) we want after
.groupby(...).mean() (or other aggregations) so that our
solutions run on current pandas. On real exams you will not be penalized
for omitting .get() when the old behavior would have
produced the same answer.
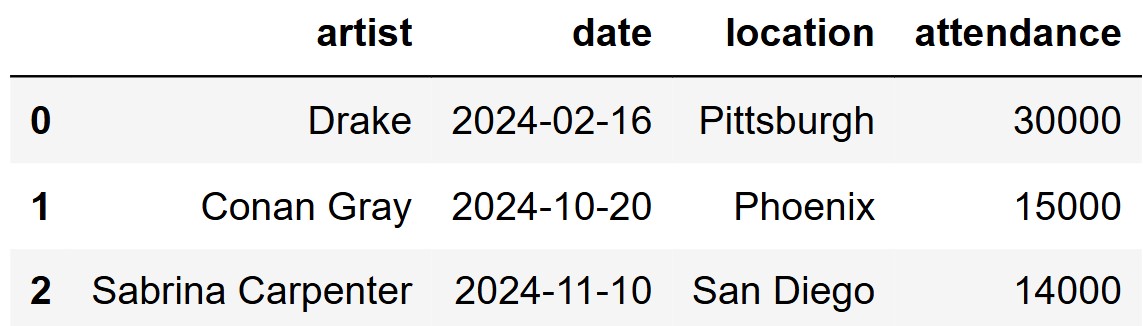
The DataFrame concerts contains data on a sample of
concerts held in 2024. For each concert, we have the name of the
performing "artist", the "date" and
"location" of the concert, and the total
"attendance" as an integer. The first few rows of
concerts are shown below:
You are interested in estimating the average
"attendance" at concerts using the data in
concerts. Fill in the blanks to define a function
estimate_attendance that takes as input a number of
estimates to produce, and returns an array with that number of
bootstrapped estimates of the mean concert attendance.
def estimate_attendance(how_many):
    estimates = np.array([])
    for i in __(a)__:
        resample = ___(b)__
        estimates = np.append(estimates, __(c)__.mean())
return estimates(a): np.arange(how_many)
(b):
concerts.sample(concerts.shape[0], replace=True)
(c): resample.get("attendance")
The average score on this problem was 82%.
Now, fill in the blanks to compute an 85\% confidence interval for the average concert attendance based on 10000 bootstrapped estimates.
boot_attendance = estimate_attendance(__(a)__)
ci_low = np.percentile(boot_attendance, __(b)__)
ci_high = np.percentile(boot_attendance, __(c)__)
concert_interval = [ci_low, ci_high](a): 10000
(b): 7.5
(c): 92.5
The average score on this problem was 90%.
Suppose concert_interval comes out to [18500, 19500]. Which of the following
statements are valid interpretations of this interval? Select all that
apply.
There is an 85\% chance that the average attendance of all concerts is between 18500 and 19500.
85\% of all concerts have an attendance between 18500 and 19500.
If we were to make many different confidence intervals based on different samples of concerts, approximately 85\% of the resulting intervals would contain the true average concert attendance.
None of the above.
Answer: Option 3 only.
The average score on this problem was 84%.
You are told that the data in the "attendance" column of
concerts has a mean of 19000 and a standard deviation of 3000. Find the endpoints of the smallest
interval which is guaranteed to contain at least \frac{15}{16} of the data. Both endpoints
should be given as integers.
Answer: [7000, 31000]
The average score on this problem was 74%.
You are now told that the data in the "attendance"
column is normally distributed. Approximately what percentage of the
data is included in the interval you gave above? Give your answer
to the nearest integer.
Answer: 100
The average score on this problem was 43%.
After this year’s Sun God Festival, the UCSD administration wants to estimate how much students would be willing to pay for a ticket to future Sun God Festivals. They (somehow) take 500 simple random samples of 100 students each, asking them this question. They then plot a histogram showing the distribution of the mean response from each sample.
Which of the following statements are true? Select all that apply.
The histogram will be approximately centered around the mean amount that all UCSD students would be willing to pay.
The variability in the histogram is due to the fact that we resample with replacement.
This distribution is an example of an empirical distribution.
This distribution includes many randomly generated parameters.
None of the above.
Answer: Options 1 and 3
The average score on this problem was 88%.
Describe in one word how the histogram would be different if it were instead based on 500 simple random samples of 1000 students each.
Answer: narrower
The average score on this problem was 70%.