← return to practice.dsc10.com
This quiz was administered in-person. It was closed-book; students
were not allowed to use the DSC 10 Reference Sheet.
Students had 20 minutes to work on the
quiz.
This quiz covered Lectures 21-24 of the Spring 2025 offering
of DSC 10.
Note (groupby / pandas 2.0): Pandas 2.0+ no longer
silently drops columns that can’t be aggregated after a
groupby, so code written for older pandas may behave
differently or raise errors. In these practice materials we use
.get() to select the column(s) we want after
.groupby(...).mean() (or other aggregations) so that our
solutions run on current pandas. On real exams you will not be penalized
for omitting .get() when the old behavior would have
produced the same answer.
In music theory, polyphony is a number that counts how many independent melodies are being played at the same time. Polyphony is an integer at any given moment, but the average polyphony for a song can be a non-integer.
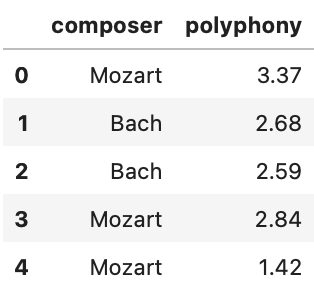
Minchan collects some data on pieces composed by Johann Sebastian
Bach and Wolfgang Amadeus Mozart. Minchan’s data is in the DataFrame
music, whose first few rows are shown at right. For each
piece, we have the composer and the average polyphony.
Minchan wants to conduct a permutation test with the following hypotheses:
Null Hypothesis: The average polyphony of pieces composed by Bach and the average polyphony of pieces composed by Mozart are drawn from the same distribution.
Alt Hypothesis: The average polyphony of pieces composed by Bach and the average polyphony of pieces composed by Mozart are drawn from different distributions.
For this permutation test, we will use the absolute difference of medians as our test statistic.
Fill in the blanks below to complete the permutation test described
above. Assume observed is the observed test statistic, and
has already been calculated correctly.
total = 0
for i in np.arange(5000):
    shuffled_composer = np.random.permutation(__(a)__)
    shuffled_df = music.assign(shuff=shuffled_composer)
    poly = shuffled_df.groupby(__(b)__).__(c)__.get("polyphony")
    stat = __(d)__
    if stat __(e)__ observed:
        __(f)__
p_value = total / 5000(a): music.get("composer")
(b): "shuff"
(c): median()
(d):
abs(poly.loc["Bach"] - poly.loc["Mozart"]) can be in either
order, can also use iloc[0], iloc[1]
instead
(e): >=
(f): total = total + 1
The average score on this problem was 58%.
The following distributions come from the "polyphony"
column of music:
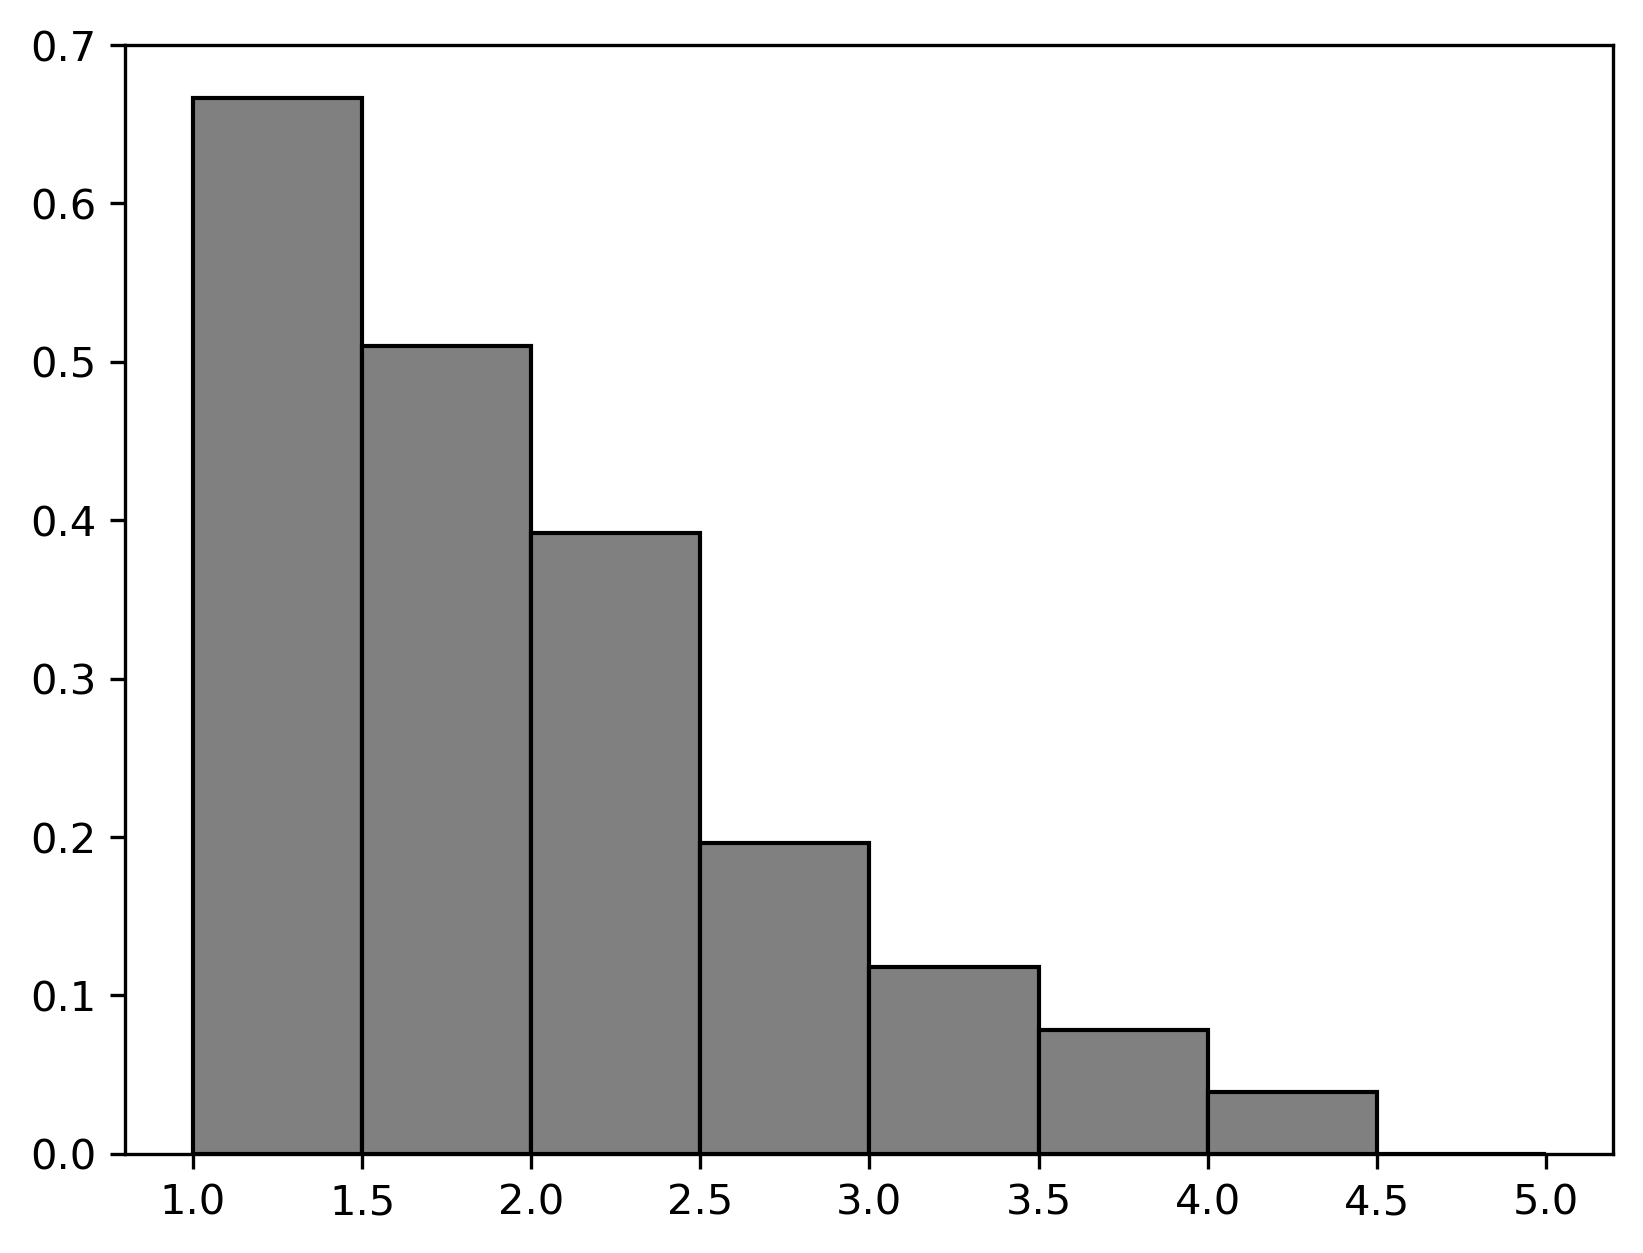
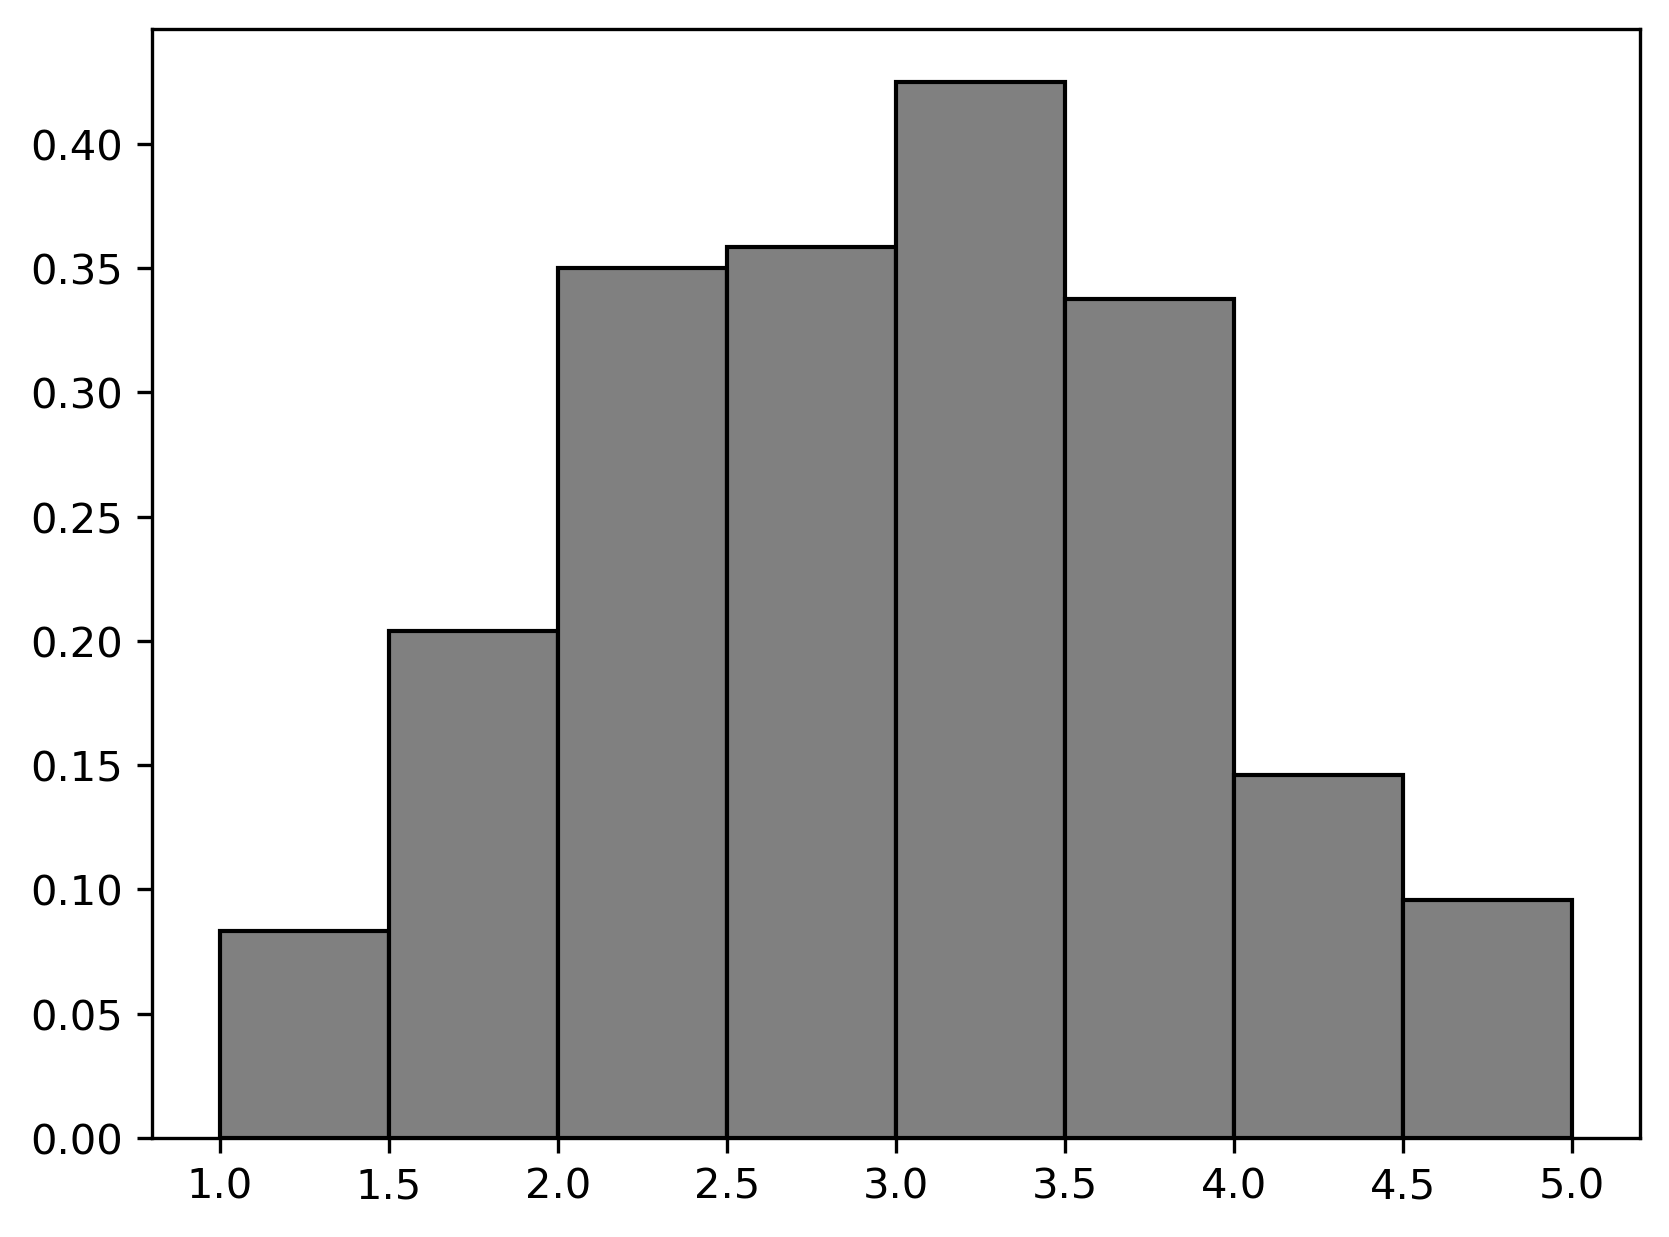
Based on these distributions, estimate the observed value of the test statistic in the permutation test above. Choose the closest answer below.
Answer: 1
The average score on this problem was 51%.
If Minchan repeats the permutation test, this time using the absolute difference of means as the test statistic, how will the observed value of the test statistic change?
The observed value of the test statistic will be smaller than before.
The observed value of the test statistic will be the same as before.
The observed value of the test statistic will be bigger than before.
Answer: Option 1
The average score on this problem was 48%.
A Musical Instrument Digital Interface (MIDI) file is a digital file format that stores musical performance data. Jack has created a small MIDI file with 10 notes. For each note i he has recorded two variables, x_i and y_i.
x_i is 1 if the note falls on a down-beat, and 0 otherwise.
y_i is the MIDI velocity, an integer from 1 to 127 representing the force with which the note should be played.
Jack’s data is below, along with some summary statistics.
| i | 1 | 2 | 3 | 4 | 5 | 6 | 7 | 8 | 9 | 10 |
|---|---|---|---|---|---|---|---|---|---|---|
| xi | 1 | 0 | 1 | 0 | 1 | 0 | 1 | 0 | 1 | 0 |
| yi | 78 | 86 | 86 | 86 | 78 | 86 | 78 | 78 | 78 | 86 |
\text{Mean}(x) = 0.5 \quad \text{SD}(x) = 0.5 \quad \text{Mean}(y) = 82 \quad \text{SD}(y) = 4
Calculate r, the correlation coefficient between x and y.
Answer: Option 1
The average score on this problem was 32%.
Calculate the slope of the regression line for the original dataset, using the value of r you chose in part (a).
Answer: -4.8
The average score on this problem was 60%.