← return to practice.dsc10.com
Instructor(s): Janine Tiefenbruck
This exam was administered in-person. Students were allowed one page of double-sided handwritten notes. No calculators were allowed. Students had 50 minutes to take this exam.
⚠️ PDF version available here .
Note (groupby / pandas 2.0): Pandas 2.0+ no longer
silently drops columns that can’t be aggregated after a
groupby, so code written for older pandas may behave
differently or raise errors. In these practice materials we use
.get() to select the column(s) we want after
.groupby(...).mean() (or other aggregations) so that our
solutions run on current pandas. On real exams you will not be penalized
for omitting .get() when the old behavior would have
produced the same answer.
A college mascot is a costumed character that represents the school at athletic competitions and other major campus events. For example, you might see UCSD’s mascot, King Triton, at basketball games and the upcoming Sun God Festival.
College students can apply to serve as the mascot for their school,
which is quite competitive! Applicants usually need to fall within a
certain height range to fit the costume. Throughout this exam, we will
format heights in feet and inches, for example "5ft 7in" or
"6ft", omitting inches when the height is a whole number of
feet, as in the second example. Recall that there are 12 inches in one
foot.
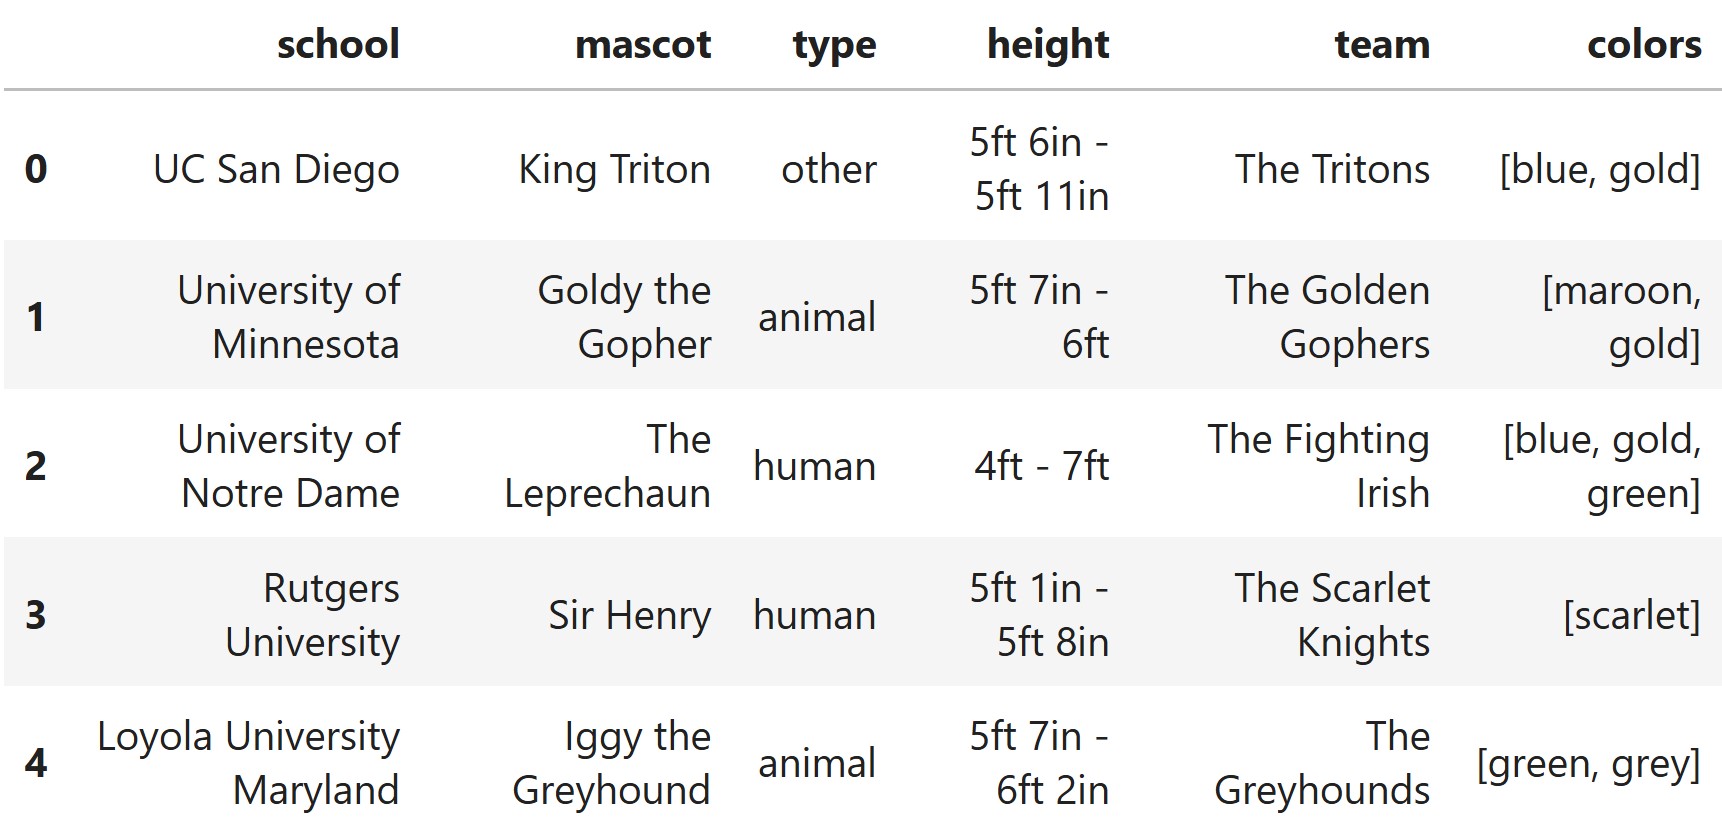
The DataFrame mascots has one row for every college or
university in the US with a named mascot. The columns are:
"school" (str): The name of the school.
This column has no repeated values."mascot" (str): The name of the school’s
mascot."type" (str): Mascot category, either
"human", "animal", or
"other"."height" (str): The range of heights that
fit into the mascot costume. Values consist of two heights, formatted as
described above, separated by " - "."team" (str): The general name of the
school’s athletic team."colors" (list): A list of the school
colors. Each school has at least one school color.The first few rows of mascots are shown below, though
mascots has many more rows than pictured.
Throughout this exam, we will refer to mascots
repeatedly. Assume that we have already run
import babypandas as bpd and
import numpy as np.
Recall that each value in the "height" column of
mascots is a string with two heights separated by
" - ". Heights are formatted like "5ft 6in" or
"6ft".
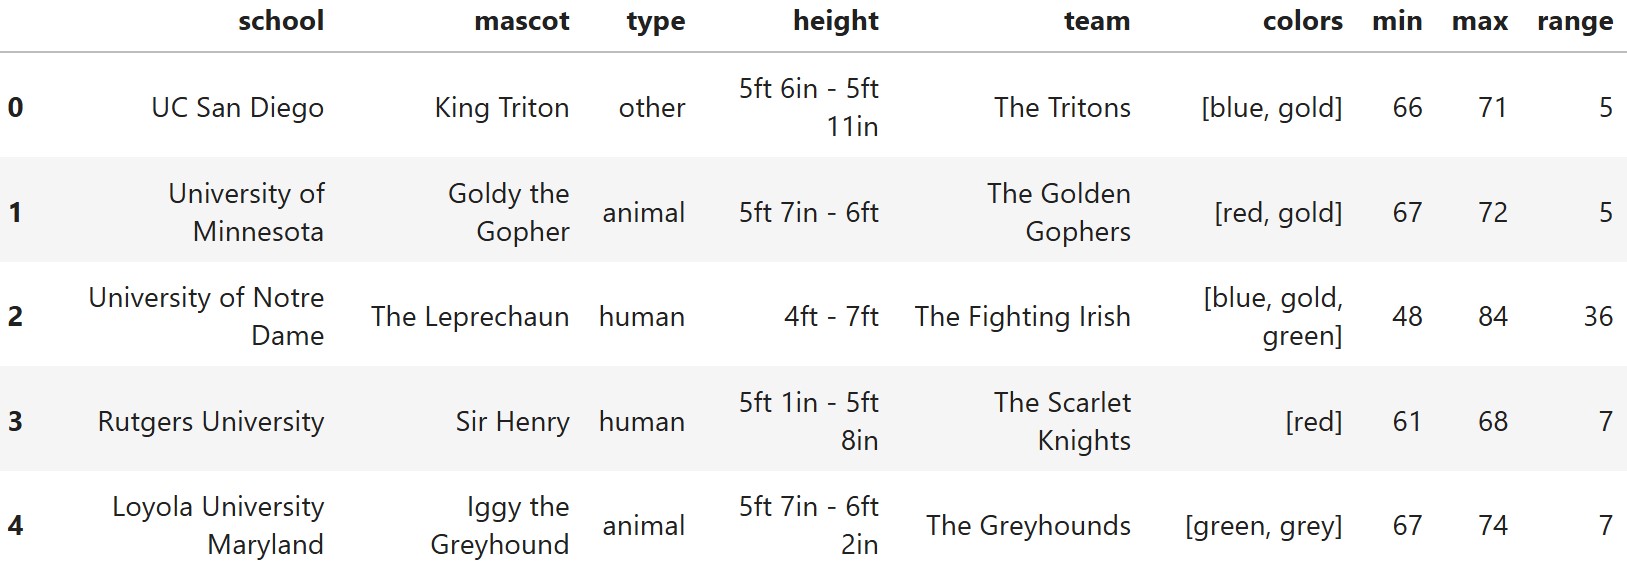
In this problem, you will need to fill in the blanks in the provided
code to add three new columns to mascots:
"min" (int) The smallest height that fits
into the mascot costume, measured in inches."max" (int) The largest height that fits
into the mascot costume, measured in inches."range" (int): The difference between the
smallest and largest heights that fit into the mascot costume, measured
in inches.After the blanks have been correctly filled in, the first five rows
of mascots should appear as follows.
To start, complete the implementation of the function
inches which takes as input a single height and returns
that height in inches, as an int. Example inputs and outputs are given
below.
>>> inches("6ft 11in")
83

>>> inches("5ft")
60

def inches(h):
    parts = h.split(" ")
    output = __(a)__
    if len(parts) == 2:
        output = __(b)__
return outputAnswer (a):
int(parts[0].strip("ft"))*12
Answer (b):
output + int(parts[1].strip("in"))
parts = h.split(" ") gives us a list. Its length is 1 if
the height doesn’t contain any inches (ex: ["6ft"]). Its
length is 2 if there is a inch aspect (ex:
["6ft", "11in"]). Regardless, the value at index 0 always
is the feet value (ex: "6ft").
"ft" from
parts[0] and convert to an integer, then multiply by 12 to get inches from feet. For
"6ft", this gives 6 \times 12 =
72."11in"), strip "in", convert to an integer,
and add it to output, which already contains the feet
converted to inches. If there is only one piece (ex:
"6ft"), we skip this step and return
output.For example, inches("6ft 11in") gives 72 + 11 = 83, and inches("5ft")
gives 60.
The average score on this problem was 57%.
Fill in the blanks below so that the code adds the three required
columns to mascots. Feel free to use the
inches function defined in part (a).
def min_height(s):
    return __(c)__

def max_height(s):
    return __(d)__

mascots = mascots.assign(min = mascots.get("height").apply(min_height))
mascots = mascots.assign(max = mascots.get("height").apply(max_height))
mascots = mascots.assign(range = __(e)__)Answer (c):
inches(s.split(" - ")[0])
Answer (d):
inches(s.split(" - ")[1])
Answer (e):
mascots.get("max") - mascots.get("min")
Each value in "height" looks like
"5ft 6in - 6ft 2in". Splitting on " - "
separates the minimum and maximum costume heights into a list of length
2 (ex: ["5ft 6 in", "6ft 2in"]).
inches to convert it to inches.inches to convert it to inches..assign creates the
"min" and "max" columns, subtract the two
Series element-wise to get "range" for each row.The .apply(min_height) and
.apply(max_height) calls run these functions on every
height string in the "height" column.
The average score on this problem was 61%.
Which of the following expressions evaluate to the name of the school with the widest height range for its mascot costume (or any such school, in the case of a tie)? Select all that apply.
Hint: .groupby orders rows in ascending
order of the values in the index.
mascots.set_index("school").get("range").max()
mascots.set_index("school").sort_values(by="range").index[-1]
mascots.groupby("range").max().get("school").iloc[-1]
mascots.groupby("school").max().index[-1]
None of the above.
Answer: Options 2 and 3.
We want the name of the school with the largest
"range" value.
mascots.set_index("school").get("range").max() returns the
largest value in the "range" column (an integer), not the
school’s name."range" puts rows
in ascending order of range, so the last row in the index
(.index[-1]) is the school with the largest range..groupby("range") orders
rows by range in ascending order. After .max(), the last
row of the resulting DataFrame corresponds to the largest range group,
and .get("school").iloc[-1] returns that school’s
name..groupby("school") orders
rows alphabetically by school name, so .index[-1] returns
the alphabetically last school, which has no relation to the range.
The average score on this problem was 71%.
Sofia defines the variables below. Note that hundred is
a DataFrame containing the first 100 rows of mascots.
hundred = mascots.take(np.arange(100))
has_state = hundred.get("school").str.contains("State")
is_animal = hundred.get("type") == "animal"What is the data type of is_animal?
string
boolean
array
Series
DataFrame
Answer: Series
is_animal is defined as
hundred.get("type") == "animal". Comparing a Series to a
string with == checks each row and returns a
boolean Series with one
True/False value per row. It is not a single
boolean, string, array, or DataFrame.
The average score on this problem was 48%.
Sofia randomly selects one row from hundred. Which
expression evaluates to the conditional probability that she selects a
school with an "animal" mascot, given that she selects a
school with "State" in its name?
(has_state & is_animal).sum() / 100
(has_state & is_animal).sum() / is_animal.sum()
(has_state & is_animal).sum() / has_state.sum()
is_animal.sum() / 100
is_animal.sum() / has_state.sum()
Answer: Option 3 —
(has_state & is_animal).sum() / has_state.sum()
We want P(\text{animal} \mid
\text{State}), the probability of an animal mascot
given that the school name contains
"State".
By the definition of conditional probability, P(\text{animal} \mid \text{State}) = \frac{P(\text{animal and State})}{P(\text{State})} = \frac{\text{Count(animal and State)}}{\text{Count(State)}} .
(has_state & is_animal).sum().has_state is true:
has_state.sum().The other options either divide by 100 (the full sample size, not the given condition) or use the wrong numerator or denominator.
The average score on this problem was 70%.
The distribution of mascot "type" in
hundred is shown in the table below.
"human" "animal" "other"
40 50 10Now, Sofia randomly selects two rows from
hundred, independently and with
replacement. What is the probability that Sofia selects at
least one school with a "human" mascot? Give your answer as
a mathematical expression, which you do not need to
simplify.
Answer:
1 - \left(\frac{60}{100}\right)^2
In hundred, 40 out of
100 schools have a "human"
mascot, so 60 out of 100 do not have a human
mascot.
Sofia selects two rows with replacement, independently. Because there are multiple ways Sofia can select a school with at least one human mascot (ex: both are human mascots, one of them is, the other one is), it is easier to find the probability of the complement: neither pick is human.
So: P(\text{at least one human}) = 1 - \left(\frac{60}{100}\right)^2.
You can simplify if you want: 1 - \left(\frac{3}{5}\right)^2 = 1 - \frac{9}{25} = \frac{16}{25} = 0.64.
The average score on this problem was 57%.
Ella creates two histograms as follows.
mascots.plot(kind="hist", y="max", density=True,
bins=np.arange(48, 85, 8))mascots.plot(kind="hist", y="max", density=True,
bins=np.arange(48, 85, 4))How many bars are in Histogram A? Give your answer as an integer.
Answer: 4
np.arange(48, 85, 8) produces the bin edges
[48, 56, 64, 72, 80]. With 5 edges, we get 5 - 1 = 4 bins, so Histogram A has 4 bars. Note that 85 is not included because
np.arange stops before its endpoint, and the next value
88 would exceed it.
The average score on this problem was 63%.
What is the largest value that can be displayed in Histogram B? Give your answer as an integer.
Answer: 84
np.arange(48, 85, 4) produces the bin edges
[48, 52, 56, 60, 64, 68, 72, 76, 80, 84]. The largest edge
is 84, which is the right edge of the
rightmost bin and therefore the largest value Histogram B can
display.
The average score on this problem was 71%.
Which of the following statements must be true? Select all that apply.
The total area of Histogram A equals the total area of Histogram B.
If no mascot has a maximum height of 70 or 71 inches, then in both histograms, the height of the bar that includes the interval [70, 71] is 0.
The proportion of mascots with maximum height between 65 and 70 inches (inclusive) can be found by adding the areas of all bars that cover any part of the interval [65, 70].
The tallest bar in Histogram B is the same height as the tallest bar in Histogram A.
None of the above.
Answer: Option 1
The average score on this problem was 78%.
Define two DataFrames single and double as
follows.
single = mascots.groupby("range").count()
double = mascots.groupby(["min", "max"]).count()Which statement below evaluates to True?
single.shape[0] < double.shape[0]
single.shape[0] == double.shape[0]
single.shape[0] > double.shape[0]
Answer: Option 1
(single.shape[0] < double.shape[0])
single groups by "range" alone, so its
number of rows equals the number of distinct range values.
double groups by the pair
("min", "max"), which is a finer grouping — two schools can
have the same range but different (min, max) pairs (e.g.,
heights 60–66 and 62–68 both have a range of 6, but different min/max
values). Therefore, double will always have at least as
many rows as single, and typically more, meaning
single.shape[0] < double.shape[0].
Note: these values would be equal if each mascot had a unique height
range. However, based on mascots from the given datasheet,
the first two rows have the same range, so this is not possible.
The average score on this problem was 68%.
Which of the following statements are true? Select all that apply.
If two schools are grouped together in single, they must
also be grouped together in double.
If two schools are grouped together in double, they must
also be grouped together in single.
If two schools are in different groups in single, they
must also be in different groups in double.
If two schools are in different groups in double, they
must also be in different groups in single.
None of the above.
Answer: Options 2 and 3
Option 1 (FALSE): Two schools grouped together
in single share the same "range". However,
they could have different (min, max) pairs (same
difference, different actual heights), so they need not be in
the same group in double.
Option 2 (TRUE): Two schools grouped together in
double share the same (min, max) pair. Since
range = max − min, they must also share the same range, so
they are guaranteed to be in the same group in
single.
Option 3 (TRUE): If two schools are in different
groups in single, they have different ranges. Since
range = max − min, they cannot share the same
(min, max) pair, so they must also be in different groups
in double.
Option 4 (FALSE): Two schools in different
groups in double have different (min, max)
pairs, but could still have the same range (e.g., 60–66 and
62–68 are different pairs but both have range 6). Therefore, they may
end up in the same group in single.
The average score on this problem was 73%.
Which statement below evaluates to True?
mascots.groupby("height").count().shape[0] < double.shape[0]
mascots.groupby("height").count().shape[0] == double.shape[0]
mascots.groupby("height").count().shape[0] > double.shape[0]
Answer: Option 2
(mascots.groupby("height").count().shape[0] == double.shape[0])
Grouping by "height" groups by the original string (ex:
"5ft 6in - 6ft 2in"). Each unique height string corresponds
to exactly one unique (min, max) pair, and vice versa —
every unique (min, max) pair maps back to exactly one
height string. Therefore, the two groupbys produce the same number of
groups, and the two shapes are equal.
The average score on this problem was 68%.
Suppose Pranav randomly selects 4 different schools from among those
included in mascots. Fill in the blanks below to implement
a simulation that estimates the probability that at least
two of the schools Pranav selected have a mascot of type
"animal".
mascot_types = np.array(mascots.get("type"))

repetitions = 10000
count_event = 0

for i in np.arange(repetitions):
    sample = np.random.choice(__(a)__)

    num_animals = np.count_nonzero(__(b)__)

    if __(c)__:
        count_event += 1

prob = __(d)__What goes in blank (a)?
mascot_types, repetitions, replace=True
mascot_types, repetitions, replace=False
mascot_types, 4, replace=True
mascot_types, 4, replace=False
Answer: Option 4
(mascot_types, 4, replace=False)
Pranav selects 4 different schools, so each simulation draw should be a sample of size 4 without replacement from the array of mascot types.
np.random.choice(mascot_types, 4, replace=False) draws
4 types from mascot_types
without putting them back.replace=True would allow the same school/type to be
chosen more than once, which does not match “4 different schools.”repetitions as the sample size would draw 10{,}000 values per trial, not 4.
The average score on this problem was 73%.
What goes in blank (b)?
Answer: sample == "animal"
sample is an array of 4
mascot types from one simulated selection. The expression
sample == "animal" compares each entry to
"animal" and returns a boolean array.
np.count_nonzero then counts how many of the 4 schools in this sample have an animal
mascot. Keep in mind that adding up a sequence of booleans results in
the total number of True’s.
The average score on this problem was 53%.
What goes in blank (c)?
Answer: num_animals >= 2
The simulation counts how often the event “at least two of the four
selected schools have an animal mascot” happens. After counting the
number of animals in the sample stored in num_animals, we
check whether that count is 2 or
more.
The average score on this problem was 66%.
What goes in blank (d)?
count_event
count_event / repetitions
count_event / 4
np.mean(count_event)
count_event.sum() / repetitions
Answer: Option 2
(count_event / repetitions)
After 10{,}000 repetitions,
count_event is the number of simulations where at least two
animal mascots were selected. Dividing by repetitions gives
the simulated proportion: \hat{p} =
\frac{\text{number of successes}}{10{,}000}, which estimates the
probability of interest.
count_event alone is a count, not a probability.count_event / 4 would divide by the sample size within
one trial, not the number of simulations.np.mean(count_event) does not apply here because
count_event is a single integer, and taking of the mean
would not result in a probability.
The average score on this problem was 79%.
The bar chart below was produced from the data in
mascots. It shows how many schools use each color.
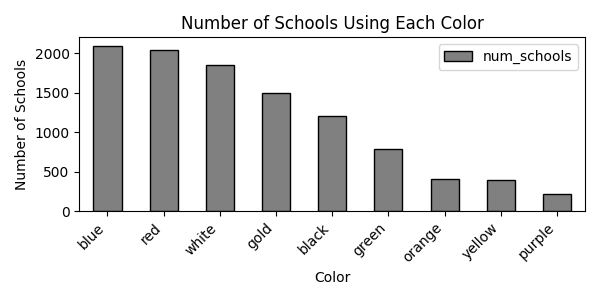
If you knew the exact heights of each bar, how could you determine
the total number of schools in mascots?
Sum the heights of all bars.
Sum the heights of all bars and divide by the number of colors (9).
You could not determine the total number of schools from this information.
Answer: Option 3
Each school can have multiple colors, and any school with more than one color is counted in multiple bars. For example, a school with school colors blue and gold contributes 1 to both the blue bar and the gold bar. This means that summing the bar heights overcounts schools, and we have no way to know how many schools were double or triple-counted (more…) just from the bar chart. Therefore, we cannot recover the total number of schools.
The average score on this problem was 87%.
In the bar chart, the height of the blue bar is 2100 and the height
of the gold bar is 1500. Use this information and the first five rows of
mascots (provided with the data description) to determine
the maximum possible number of schools in
mascots whose school colors are blue and gold
only. Give your answer as an
integer.
Answer: 1498
A school whose colors are “blue and gold only” must appear in both the blue bar (height 2100) and the gold bar (height 1500), so the answer is at most \min(2100, 1500) = 1500.
To maximize the count, we want as many of the 1500 gold-using schools as possible to also
use blue, and to use no other color. However, the first
five rows of mascots show specific schools that use gold
along with a color other than blue (or use gold without blue at all).
Each such school is one of the 1500
gold schools but cannot be counted in our group.
From the first five rows, exactly 2 schools using gold are disqualified in this way, so the maximum possible number of “blue and gold only” schools is 1500 - 2 = 1498.
The average score on this problem was 44%.
Write one line of code that uses the mascots DataFrame
to calculate the sum of the heights of all bars in the bar chart
above.
Answer:
mascots.get("colors").apply(len).sum()
The sum of the bar heights counts each school once for every color it has (a school with 3 colors contributes 1 to each of 3 bars, for a total of 3). This means that the total bar height equals the total number of (school, color) pairs across the dataset.
The "colors" column contains a list for each school, and
the length of that list is the number of colors the school has. Applying
len to each list and then summing it all gives exactly the
total count of (school, color) pairs, which equals the sum of bar
heights.
The average score on this problem was 31%.
Austin and Ray are contestants on Season One of America’s Next
Top Mascot, a new reality TV show. In each episode, contestants
will compete for one of the mascot roles in the DataFrame below, called
antm. The data includes the name of each mascot and the
minimum and maximum heights, in inches, for the costume.
The America’s Next Top Mascot costume director wants to identify every pair of costumes where one costume’s maximum height exactly equals the other costume’s minimum height. She calls these “single-height costume pairs" because there is only a single height that can wear both costumes.
Write one line of code that uses .merge to calculate the
number of single-height costume pairs in antm. Your answer
should be a Python expression that evaluates to an
integer.
Answer:
antm.merge(antm, left_on="min", right_on="max").shape[0]
A “single-height costume pair” is a pair of costumes where one
costume’s "max" equals the other costume’s
"min". To find these, we merge antm with
itself, matching the "min" column of the left copy to the
"max" column of the right copy. Each row in the merged
DataFrame corresponds to exactly one such pair, so
.shape[0] gives the count.
The average score on this problem was 67%.
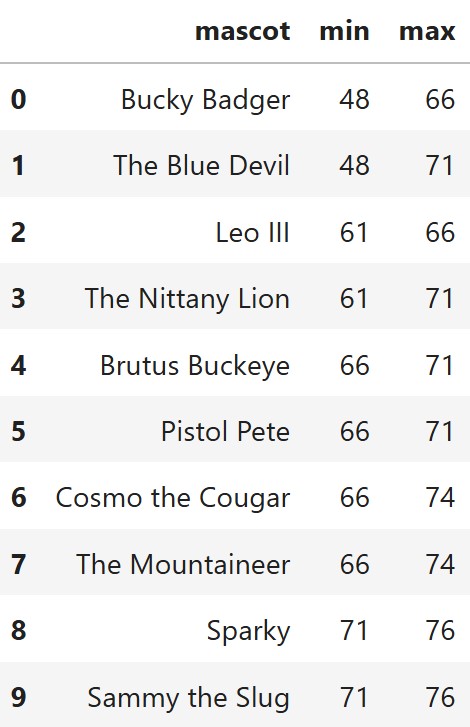
What is the number of single-height costume pairs? In other words, what number does a correct answer to part (a) evaluate to? Give your answer as an integer.
Answer: 16
This is the value that the expression in part (a) evaluates to when
run on antm. Going through the "min" and
"max" columns of antm and counting how many
(costume A, costume B) pairs satisfy A.min == B.max, we
find 16 such pairs. Equivalently, for
each "max" value in the table, count how many costumes have
that value as their "min", then sum those counts across all
rows; the total is 16.
Looking at antm, we can see there are 4
mascots that have a minimum height of 66, and 2 mascots with a
maximum height of 66. Additionally,
there are 2 with a minimum of 71 and 4 with a maximum of
71. This gives us a total of 4 \times 2 + 2 \times 4 = 16 single-height
costume pairs.
The average score on this problem was 54%.
The last episode of the season will reveal the mascot roles to be
featured next season. Next season’s mascots are stored in a DataFrame
called antm2 which has the same column names as
antm, but contains different data (i.e. a different set of
mascots).
We don’t have all of antm2 available, but do know some
information about it. First, we know that
antm2.merge(antm2, on="min") gives a DataFrame with 61
rows.
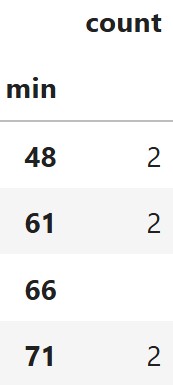
Additionally, we have the table at right, which shows the number of
mascots in antm2 with each minimum height requirement,
except one value is missing.How many mascots in antm2 have
a minimum height requirement of 66 inches? Give your answer as an
integer.
Answer: 7
When we merge a DataFrame with itself on "min", every
row pairs up with every other row that shares the same
"min" value (including itself). This means that if a
particular "min" value appears n times in antm2, it contributes
n \times n = n^2 rows to the merged
DataFrame.
The total number of rows is therefore the sum of squares of the counts in the table:
n_1^2 + n_2^2 + \dots + x^2 = 61
where x is the missing count for
"min" = 66. Plugging in
the known counts from the table, the squares of the visible values sum
to 12, leaving:
x^2 = 61 - 12 = 49 \implies x = 7
Therefore, 7 mascots in
antm2 have a minimum height requirement of 66 inches.
The average score on this problem was 32%.