← return to practice.dsc10.com
This quiz was administered in-person. It was closed-book and
closed-note; students were not allowed to use the DSC
10 Reference Sheet. Students had 20 minutes to work on
the quiz.
This quiz covered Lectures 18-21 of the Spring 2026 offering
of DSC 10.
Note (groupby / pandas 2.0): Pandas 2.0+ no longer
silently drops columns that can’t be aggregated after a
groupby, so code written for older pandas may behave
differently or raise errors. In these practice materials we use
.get() to select the column(s) we want after
.groupby(...).mean() (or other aggregations) so that our
solutions run on current pandas. On real exams you will not be penalized
for omitting .get() when the old behavior would have
produced the same answer.
Comic-Con is a massive pop culture and entertainment convention held each summer at the San Diego Convention Center. UC San Diego is capitalizing on its proximity to this major event and is offering Comic Con weekend accommodations in empty dorm rooms.
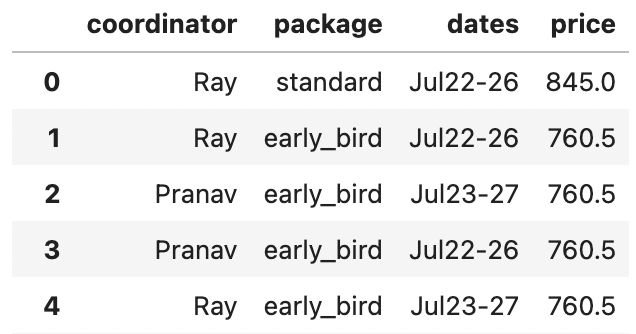
UCSD housing coordinators Pranav and Ray each processed a random
sample of 25 Comic Con housing reservations. The res
DataFrame has 50 rows, each of which represents a reservation processed
by Pranav or Ray. Below are column descriptions and a preview of the
first few rows of the DataFrame.
"coordinator" (str): either
"Pranav" or "Ray""package" (str): either
"early_bird" or "standard""dates" (str): either
"Jul22-26" or "Jul23-27""price" (float): 760.50 for
"early_bird" and 845.00 for
"standard"::: tabular @p0.5@p0.4@ The number of reservations for each of the
"dates" processed by each coordinator are given in the
table to the right. &
"Pranav" |
"Ray" |
|
|---|---|---|
"Jul22-26" |
20 | 18 |
"Jul23-27" |
5 | 7 |
Compute the total variation distance (TVD) between Pranav’s
distribution of "dates" and Ray’s distribution of
"dates". Give your answer as an exact decimal or
simplified fraction.
Answer: 0.08
The average score on this problem was 37%.
@p0.5@p0.4@ The table to the right shows how many reservations of
each "package" type were processed by each coordinator.
&
"Pranav" |
"Ray" |
|
|---|---|---|
"early_bird" |
p |
r |
"standard" |
25 - p |
25 - r |
Which of the following expressions correctly computes the TVD between
Pranav’s distribution of "package" type and Ray’s
distribution of "package" type?
(p - r) / 25
abs(p - r) / 25
0.5 * abs(p - r) / 25
0.5 * sum(abs(p / 25 - r / 25))
0.5 * (abs(p - r) + abs((25 - p) - (25 - r)))
Answer: Option B
The average score on this problem was 14%.
Pranav is doing a hypothesis test with the following null hypothesis:
in the population of reservations, each reservation has a 30\% chance of being
"early_bird". His test statistic is the
percentage of "early_bird" reservations,
and his observed data is all of the data in
res. Write one line of code to calculate one simulated
value of the test statistic under the assumptions of the null. Your code
should produce an integer between 0 and 100.
Answer:
np.random.multinomial(50, [0.3, 0.7])[0] / 50 * 100
The average score on this problem was 45%.
The housing director, Ella, wants to know whether Ray’s reservations
have significantly higher prices than Pranav’s. Ella has access to
res but no knowledge of the population distribution of
reservation prices.
Which pair of hypotheses should be used for Ella’s test? Select the best answer.
Null: The mean price for Ray equals the mean price for Pranav. Alt: The mean price for Ray does not equal the mean price for Pranav.
Null: Ray’s prices come from a population with mean $802.75. Alt: Ray’s prices come from a population with mean larger than $802.75.
Null: Pranav and Ray’s reservations come from the same price distribution. Alt: Ray’s reservations come from a price distribution with a larger mean than Pranav’s.
Answer: Option 3
The average score on this problem was 84%.
Which of the following approaches are appropriate for Ella’s goal? Select all that apply.
Run a permutation test by shuffling coordinator labels and using the difference in mean prices as the test statistic.
Run a permutation test by shuffling prices and using the absolute difference in mean prices as the test statistic.
Bootstrap a 95% confidence interval for the difference in mean prices, then check whether 0 is in the interval.
Run a standard hypothesis test to see whether Ray’s sample mean looks
like the mean of a simple random sample taken from res, or
whether it is too high.
None of the above.
Answer: Options 1 and 4.
The average score on this problem was 54%.
Suppose Ella performs a test where the test statistic is Pranav’s mean price minus Ray’s mean price. The observed value of the test statistic is -50.7. Which simulated statistics should be counted when computing the p-value?
Simulated statistics greater than or equal to -50.7.
Simulated statistics less than or equal to -50.7.
Simulated statistics whose absolute value is greater than or equal to 50.7.
Simulated statistics whose absolute value is less than or equal to 50.7.
Answer: Option 2
The average score on this problem was 59%.