← return to practice.dsc10.com
Instructor(s): Suraj Rampure
This exam was administered remotely via Gradescope. The exam was open-internet, and students were able to use Jupyter Notebooks. They had 50 minutes to work on it.
Note (groupby / pandas 2.0): Pandas 2.0+ no longer
silently drops columns that can’t be aggregated after a
groupby, so code written for older pandas may behave
differently or raise errors. In these practice materials we use
.get() to select the column(s) we want after
.groupby(...).mean() (or other aggregations) so that our
solutions run on current pandas. On real exams you will not be penalized
for omitting .get() when the old behavior would have
produced the same answer.
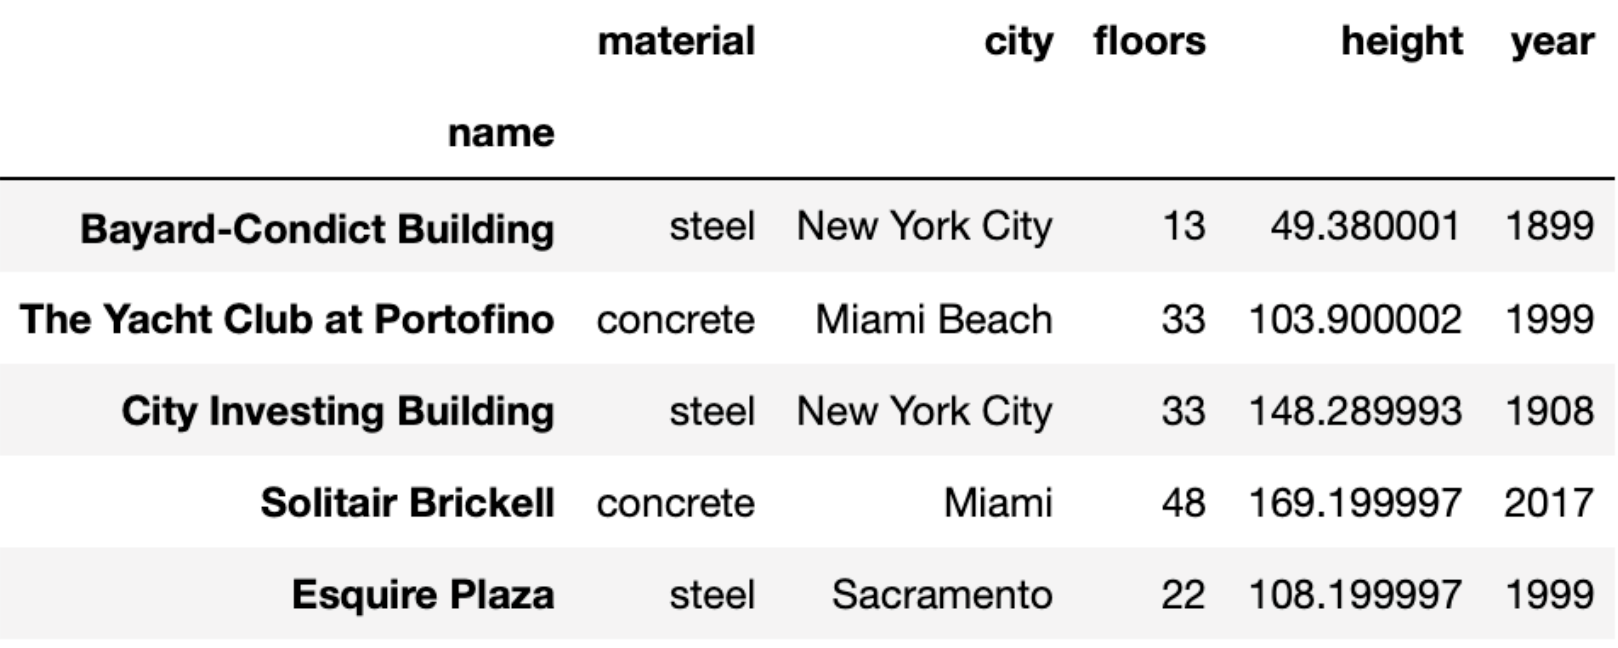
Welcome to the Midterm Exam for DSC 10 Winter 2022! Throughout this
exam, we will work with a dataset consisting of various skyscrapers in
the US, which we’ve loaded into a DataFrame called sky. The
first few rows of sky are shown below (though the full
DataFrame has more rows):
Each row of sky corresponds to a single skyscraper. For
each skyscraper, we have: - its name, which is stored in the index of
sky (string) - the 'material' it is made up of
(string) - the 'city' in the US where it is located
(string) - the number of 'floors' (levels) it contains
(int) - its 'height' in meters (float), and - the
'year' in which it was opened (int)
Note that the height of a floor may be different in each building.
Tip: Open this page in another tab, so that it is easy to refer to this data description as you work through the exam.
Below, identify the data type of the result of each of the following expressions, or select “error” if you believe the expression results in an error.
sky.sort_values('height')int or float
Boolean
string
array
Series
DataFrame
error
Answer: DataFrame
sky is a DataFrame. All the sort_values
method does is change the order of the rows in the Series/DataFrame it
is called on, it does not change the data structure. As such,
sky.sort_values('height') is also a DataFrame.
The average score on this problem was 87%.
sky.sort_values('height').get('material').loc[0]int or float
Boolean
string
array
Series
DataFrame
error
Answer: error
sky.sort_values('height') is a DataFrame, and
sky.sort_values('height').get('material') is a Series
corresponding to the 'material' column, sorted by
'height' in increasing order. So far, there are no
errors.
Remember, the .loc accessor is used to access
elements in a Series based on their index.
sky.sort_values('height').get('material').loc[0] is asking
for the element in the
sky.sort_values('height').get('material') Series with index
0. However, the index of sky is made up of building names.
Since there is no building named 0, .loc[0]
causes an error.
The average score on this problem was 79%.
sky.sort_values('height').get('material').iloc[0]int or float
Boolean
string
array
Series
DataFrame
error
Answer: string
As we mentioned above,
sky.sort_values('height').get('material') is a Series
containing values from the 'material' column (but sorted).
Remember, there is no element in this Series with an index of 0, so
sky.sort_values('height').get('material').loc[0] errors.
However, .iloc[0] works differently than
.loc[0]; .iloc[0] will give us the first
element in a Series (independent of what’s in the index). So,
sky.sort_values('height').get('material').iloc[0] gives us
back a value from the 'material' column, which is made up
of strings, so it gives us a string. (Specifically, it gives us the
'material' type of the skyscraper with the smallest
'height'.)
The average score on this problem was 89%.
sky.get('city').apply(len)int or float
Boolean
string
array
Series
DataFrame
error
Answer: Series
The .apply method takes in a function and evaluates that
function on every element in a Series. Here,
sky.get('city').apply(len) is using the function
len on every element in the Series
sky.get('city'). The result is also a Series, containing
the lengths of the names of each 'city'.
The average score on this problem was 79%.
sky.get('city').apply(max)int or float
Boolean
string
array
Series
DataFrame
error
Answer: Series
This is a tricky problem!
The function that apply takes in must work on individual
elements in a Series, i.e. it must work with just a single argument. We
saw this in the above subpart, where
sky.get('city').apply(len) applied len on each
'city' name.
Here, we are trying to apply the max function on each
'city' name. The max of a single item does not
work in Python, because taking the max requires comparing
two or more elements. Try it out - in a notebook, run the expression
max(5), and you’ll see an error. So, if we tried to use
.apply(max) on a Series of numbers, we’d run into an
error.
However, we are using .apply(max) on a
Series of strings, and it turns out that Python does
allow us to take the max of a string! The max
of a string in Python is defined as the last character in the string
alphabetically, so max('hello') evaluates to
'o'. This means that
sky.get('city').apply(max) does actually run without error;
it evaluates to a Series containing the last element in the name of each
'city'.
(This subpart was trickier than we intended – we ended up giving credit to both “error” and “Series”.)
The average score on this problem was 89%.
sky.get('floors').max()int or float
Boolean
string
array
Series
DataFrame
error
Answer: int or float
The Series sky.get('floors') is made up of integers, and
sky.get('floors').max() evaluates to the largest number in
the Series, which is also an integer.
The average score on this problem was 91%.
sky.groupby('material').max()int or float
Boolean
string
array
Series
DataFrame
error
Answer: DataFrame
When grouping and using an aggregation method, the result is always a
DataFrame. The DataFrame sky.groupby('material').max()
contains all of the columns in sky, minus
'material', which has been moved to the index. It contains
one row for each unique 'material'.
Note that no columns were “dropped”, as may happen when using
.mean(), because .max() can work on Series’ of
any type. You can take the max of strings, while you cannot take the
mean of strings.
The average score on this problem was 78%.
sky.index[0]int or float
Boolean
string
array
Series
DataFrame
error
Answer: string
sky.index contains the values
'Bayard-Condict Building',
'The Yacht Club at Portofino',
'City Investing Building', etc. sky.index[0]
is then 'Bayard-Condict Building', which is a string.
The average score on this problem was 91%.
In this question, we’ll write code to learn more about the skyscrapers in the beautiful city of San Diego. (Unrelated fun fact – since the San Diego Airport is so close to downtown, buildings in downtown San Diego legally cannot be taller than 152 meters.)
Below, fill in the blank to create a DataFrame, named
san_tall, consisting of just the skyscrapers in San Diego
that are over 100 meters tall.
condition = ______
san_tall = sky[(sky.get('city') == 'San Diego') & condition]
What goes in the blank?
Answer: sky.get('height') > 100
We need to query for all of the skyscrapers that satisfy two
conditions – the 'city' must be 'San Diego'
and the 'height' must be above 100. The first condition was
already implemented for us, so we just need to construct a Boolean
Series that implements the second condition.
Here, we want all of the rows where 'height' is above
100, so we get the 'height' column and compare
it to 100 like so: sky.get('height') > 100.
The average score on this problem was 95%.
Suppose san_tall from the previous part was created
correctly. Fill in the blanks so that height_many_floors
evaluates to the height (in meters) of the skyscraper
with the most floors, amongst all skyscrapers in San
Diego that are over 100 meters tall.
height_many_floors = san_tall.______.iloc[0]What goes in the blank?
Answer:
sort_values('floors', ascending=False).get('height')
The end of the line given to us is .iloc[0]. We know
that .iloc[0] extracts the first element in whatever Series
it is called on, so what comes before .iloc[0] must be a
Series where the first element is the 'height' of the
skyscraper with the most floors, among all skyscrapers in San Diego that
are over 100 meters tall. The DataFrame we are working with,
san_tall, already only has skyscrapers in San Diego that
are over 100 meters tall.
This means that in the blank, all we need to do is:
'floors' in decreasing order (so
that the first row is the skyscraper with the most
'floors').'height' column.As such, a complete answer is
height_many_floors = san_tall.sort_values('floors', ascending=False).get('height').iloc[0].
The average score on this problem was 74%.
height_many_floors, the value you computed in the
previous part (2.2) was a number.
True or False: Assuming that the DataFrame
san_tall contains all skyscrapers in San Diego,
height_many_floors is the height (in meters) of the
tallest skyscraper in San Diego.
True
False
Answer: False
height_many_floors is the height of the skyscraper with
the most 'floors'. However, this is not necessarily the
tallest skyscraper (i.e. the skyscraper with the largest
'height')! Consider the following scenario:
height_many_floors would be 100, but it is not the
'height' of the taller building.
The average score on this problem was 84%.
Note that each part of Question 3 depends on previous parts of Question 3.
In this question, we’ll take a closer look at the
'material' column of sky.
Below, fill in the blank to complete the implementation of the
function majority_concrete, which takes in the name of a
city and returns True if the majority of the
skyscrapers in that city are made of concrete, and False
otherwise. We define “majority” to mean “at least
50%”.
def majority_concrete(city):
    all_city = sky[sky.get('city') == city]
    concrete_city = all_city[all_city('material') == 'concrete']
    proportion = ______
    return proportion >= 0.5
What goes in the blank?
Answer:
concrete_city.shape[0] / all_city.shape[0]
Let’s first understand the code that is already provided for us. Note
that city is a string corresponding to the name of a
city.
all_city contains only the rows for the passed in
city. Note that all_city.shape[0] or
len(all_city) is the number of rows in
all_city, i.e. it is the number of skyscrapers in
city. Then, concrete_city contains only the
rows in all_city corresponding to 'concrete'
skyscrapers, i.e. it contains only the rows corresponding to
'concrete' skyscrapers in city. Note that
concrete_city.shape[0] or len(concrete_city)
is the number of skyscrapers in city that are made of
'concrete'.
We want to return True only if at least 50% of the
skyscrapers in city are made of concrete. The last line in
the function, return proportion >= 0.5, is already
provided for us, so all we need to do is compute the proportion of
skyscrapers in city that are made of concrete. This is
concrete_city.shape[0] / all_city.shape[0].
Another possible answer is
len(concrete_city) / len(all_city).
The average score on this problem was 85%.
Below, we create a DataFrame named by_city.
by_city = sky.groupby('city').count().reset_index()Below, fill in the blanks to add a column to by_city,
called 'is_majority', that contains the value
True for each city where the majority of skyscrapers are
concrete, and False for all other cities. You may need to
use the function you defined in the previous subpart.
by_city = by_city.assign(is_majority = ______)What goes in the blank?
Answer:
by_city.get('city').apply(majority_concrete)
We are told to add a column to by_city. Recall, the way
that .assign works is that the name of the new column comes
before the = symbol, and a Series (or array) containing the
values for the new column comes after the = symbol. As
such, a Series needs to go in the blank.
majority_concrete takes in the name of a single
city and returns either True or
False accordingly. All we need to do here then is use the
majority_concrete function on every element in the
'city' column. After accessing the 'city'
column using by_city.get('city'), we need to use the
.apply method using the argument
majority_concrete. Putting it all together yields
by_city.get('city').apply(majority_concrete), which is a
Series.
Note: Here, by_city.get('city') only works because
.reset_index() was used in the line where
by_city was defined. If we did not reset the index,
'city' would not be a column!
The average score on this problem was 86%.
by_city now has a column named
'is_majority' as described in the previous subpart. Now,
suppose we create another DataFrame, mystery, below:
mystery = by_city.groupby('is_majority').count()What is the largest possible value that mystery.shape[0]
could evaluate to?
Answer: 2
Recall, the 'is_majority' column we created in the
previous subpart contains only two possible values – True
and False. When we group by_city by
'is_majority', we create two “groups” – one for
True and one for False. As such, no matter
what aggregation method we use (here we happened to use
.count()), the resulting DataFrame will only have 2 rows
(again, one for True and one for False).
Note: The question asked for the “largest possible value” that
mystery.shape[0], because it is possible that
mystery only has 1 row. This can only happen in two
cases:
'concrete'.'concrete'.
The average score on this problem was 76%.
Suppose
mystery.get('city').iloc[0] == mystery.get('city').iloc[1]
evaluates to True.
True or False: In exactly half of the cities in
sky, it is true that a majority of skyscrapers are made of
'concrete'. (Tip: Walk through
the manipulations performed in the previous three subparts to get an
idea of what mystery looks like and contains.)
True
False
Answer: True
In the solution to the previous subpart, we noted that
mystery contains at most 2 rows, one corresponding to
cities where 'is_majority' is True and one
corresponding to cities where 'is_majority' is
False. Furthermore, recall that we used the
.count() aggregation method, which means that the entries
in each column of mystery contain the
number of cities where 'is_majority' is
True and the number of cities where
'is_majority' is False.
If
mystery.get('city').iloc[0] == mystery.get('city').iloc[1],
it must be the case that the number of cities where
'is_majority' is True and False
are equal. This must mean that in exactly half of the cities in
sky, it is true that the majority of skyscrapers are made
of 'concrete'.
The average score on this problem was 69%.
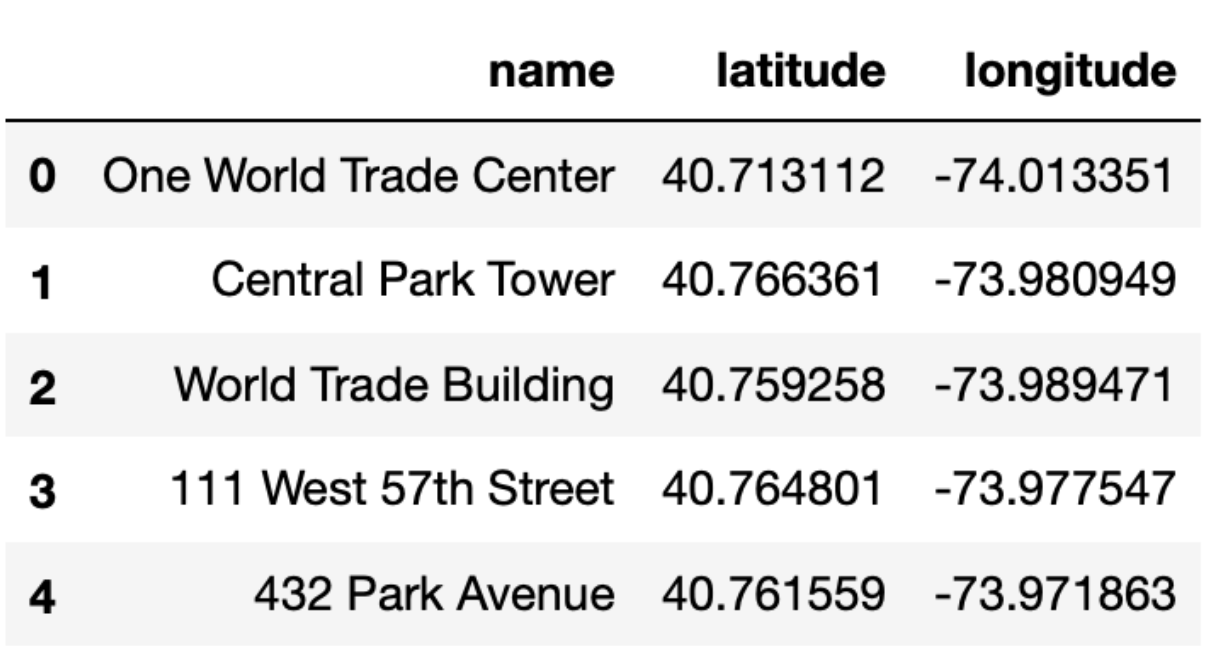
Suppose we have access to another DataFrame, new_york,
that contains the latitude and longitude of every single skyscraper in
New York City that is also in sky. The first few rows of
new_york are shown below.
Below, we define a new DataFrame, sky_with_location,
that merges together both sky and
new_york.
sky_with_location = sky.merge(new_york, left_index=True, right_on='name')Given that:
sky has s rows,new_york has n rows,
andsky and new_york, i.e. that there are no typos
in either DataFrame,select the true statement below.
sky_with_location has exactly s rows.
sky_with_location has exactly n rows.
sky_with_location has exactly s - n rows.
sky_with_location has exactly s + n rows.
sky_with_location has exactly s \times n rows.
Answer: sky_with_location has exactly
n rows.
Here, we are merging sky and new_york on
skyscraper names (stored in the index in sky and in the
'name' column in new_york). The resulting
DataFrame, sky_with_location, will have one row for each
“match” between skyscrapers in sky and
new_york. Since skyscraper names are presumably unique,
sky_with_location will have one row for each skyscraper
that is in both sky and new_york.
The skyscrapers that are in both sky and
new_york are just the skyscrapers in new_york,
since all of the non-New York skyscrapers in sky won’t be
in new_york. As such, sky_with_location has
the same number of rows as new_york. new_york
has n rows, so
sky_with_location also has n rows.
The average score on this problem was 64%.
Recall, the interval [a, b) refers to numbers greater than or equal to a and less than b, and the interval [a, b] refers to numbers greater than or equal to a and less than or equal to b.
Suppose we created a DataFrame, medium_sky, containing
only the skyscrapers in sky whose number of floors are in
the interval [20, 60]. Below, we’ve
drawn a histogram of the number of floors of all skyscrapers in
medium_sky.
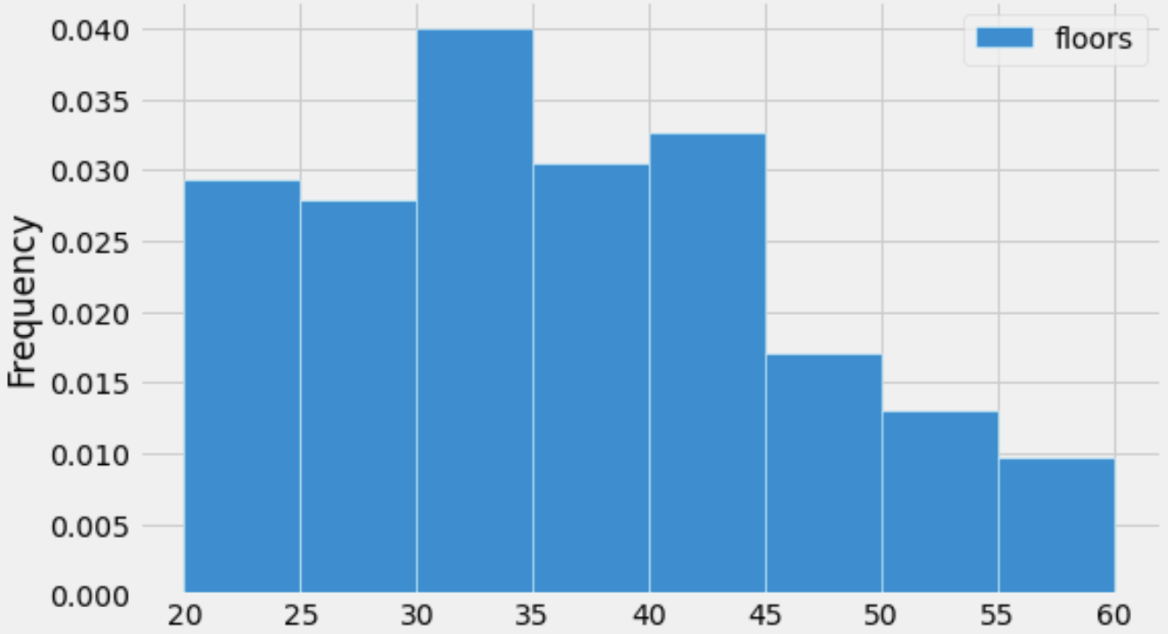
Suppose that there are 160 skyscrapers whose number of floors are in the interval [30, 35).
Given this information and the histogram above, how many skyscrapers
are there in medium_sky?
Answer: 800
Recall, in a histogram,
\text{proportion of values in bin} = \text{area of bar} = \text{width of bin} \cdot \text{height of bar}
Also, note that:
\text{\# of values satisfying condition} = \text{proportion of values satisfying condition} \cdot \text{total \# of values}
Here, we’re given the entire histogram, so we can find the proportion
of values in the [30, 35) bin. We are
also given the number of values in the [30,
35) bin (160). This means we can use the second equation above to
find the total number of skyscrapers in medium_sky.
The first step is finding the area of the [30, 35) bin’s bar. Its width is 35-30 = 5, and its height is 0.04, so its area is 5 \cdot 0.04 = 0.2. Then,
\begin{aligned} \text{\# of values satisfying condition} &= \text{proportion of values satisfying condition} \cdot \text{total \# of values} \\ 160 &= 0.2 \cdot \text{total \# of values} \\ \implies \text{total \# of values} &= \frac{160}{0.2} = 160 \cdot 5 = 800 \end{aligned}
The average score on this problem was 62%.
Again, suppose that there are 160 skyscrapers whose number of floors are in the interval [30, 35).
Now suppose that there is a typo in the medium_sky
DataFrame, and 20 skyscrapers were accidentally listed as having 53
floors each when instead they actually only have 35 floors each. The
histogram drawn above contains the incorrect version of the data.
Suppose we re-draw the above histogram using the correct data. What will be the new heights of both the [35, 40) bar and [50, 55) bar? Select the closest answer.
The [35, 40) bar’s height becomes 0.0325, and the [50, 55) bar’s height becomes 0.0105.
The [35, 40) bar’s height becomes 0.035, and the [50, 55) bar’s height becomes 0.008.
The [35, 40) bar’s height becomes 0.0375, and the [50, 55) bar’s height becomes 0.0055.
The [35, 40) bar’s height becomes 0.04, and the [50, 55) bar’s height becomes 0.003.
Answer: The [35, 40) bar’s height becomes 0.035, and the [50, 55) bar’s height becomes 0.008.
The current height of the [35, 40) bar is 0.03, and the current height of the [50, 55) bar is 0.013 (approximately; its height appears to be slightly more than halfway between 0.01 and 0.015). We need to decrease the height of the [50, 55) bar and increase the height of the [35, 40) bar. The combined area of both bars must stay the same, since the proportion of values in their bins (together) is not changing. This means that the amount we need to decrease the [50, 55) bar’s height by is the same as the amount we need to increase the [35, 40) bar’s height by. Note that this relationship is true in all 4 answer choices.
In the question, we were told that 20 skyscrapers were incorrectly binned. There are 800 skyscrapers total, so the proportion of skyscrapers that were incorrectly binned is \frac{20}{800} = 0.025. This means that the area of the [35, 40) bar needs to increase by 0.025 and the area of the [50, 55) bar needs to decrease by 0.025. Recall, each bar has width 5. That means that the “rectangular section” we will add to the [35, 40) bar and remove from the [50, 55) bar has height
\text{height} = \frac{\text{area}}{\text{width}} = \frac{0.025}{5} = 0.005
Thus, the height of the [35, 40) bar becomes 0.03 + 0.005 = 0.035 and the height of the [50, 55) bar becomes 0.013 - 0.005 = 0.008.
The average score on this problem was 74%.
Consider the following line plot, which depicts the number of skyscrapers built per year.
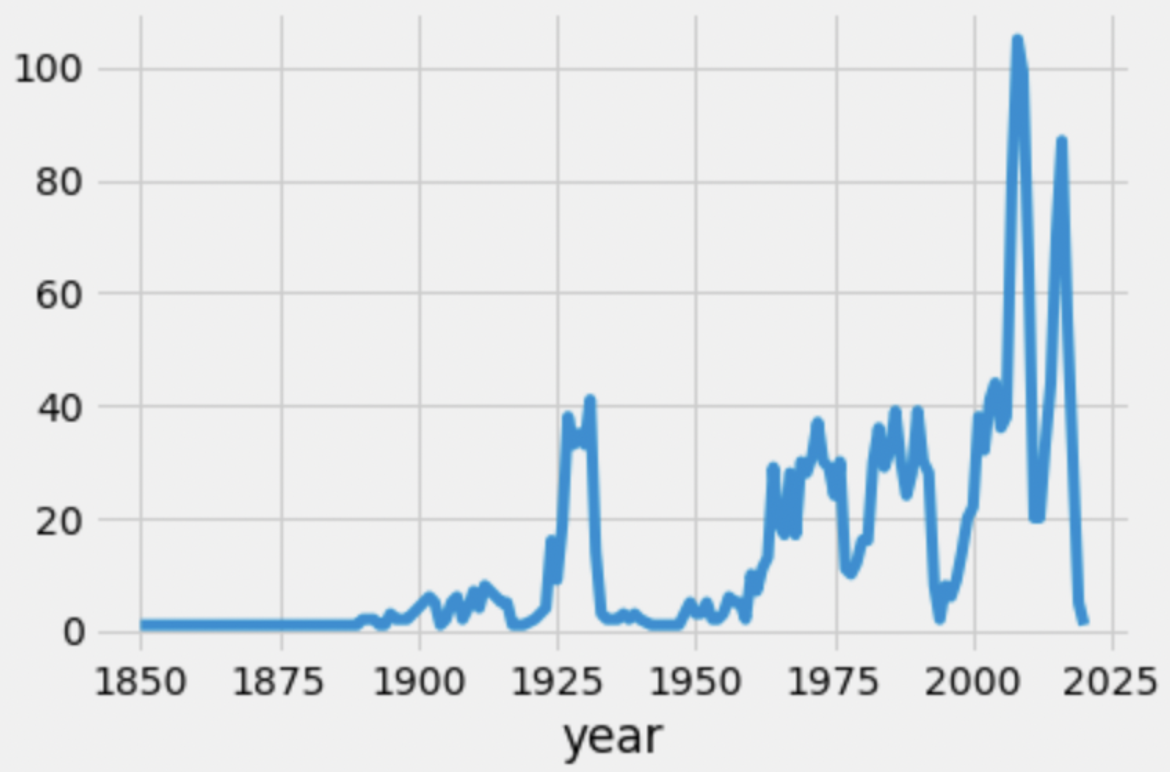
We created the line plot above using the following line of code:
sky.groupby('year').count().plot(kind='line', y='height');Which of the following could we replace 'height' with in
the line of code above, such that the resulting line of code creates the
same line plot? Select all that apply.
'name'
'material'
'city'
'floors'
'year'
None of the above
Answers: 'material',
'city', and 'floors'
Recall that when we use the .count() aggregation method
while grouping, the values in all resulting columns are the same (they
all contain the number of values in each unique group). This means that
any column of sky.groupby('year').count() can replace
'height' in the provided line.
'name' is not a column in
sky.groupby('year').count(). 'name' was the
index in sky, but is not present at all in
sky.groupby('year').count() (the original index is lost
completely). 'year' is also not a column in
sky.groupby('year').count(), since it is the index. The
remaining three columns – 'material', 'city',
and 'floors' – would all work.
The average score on this problem was 74%.
Note: This problem is out of scope; it covers material no longer included in the course.
Now let’s look at the number of skyscrapers built each year since 1975 in New York City 🗽.
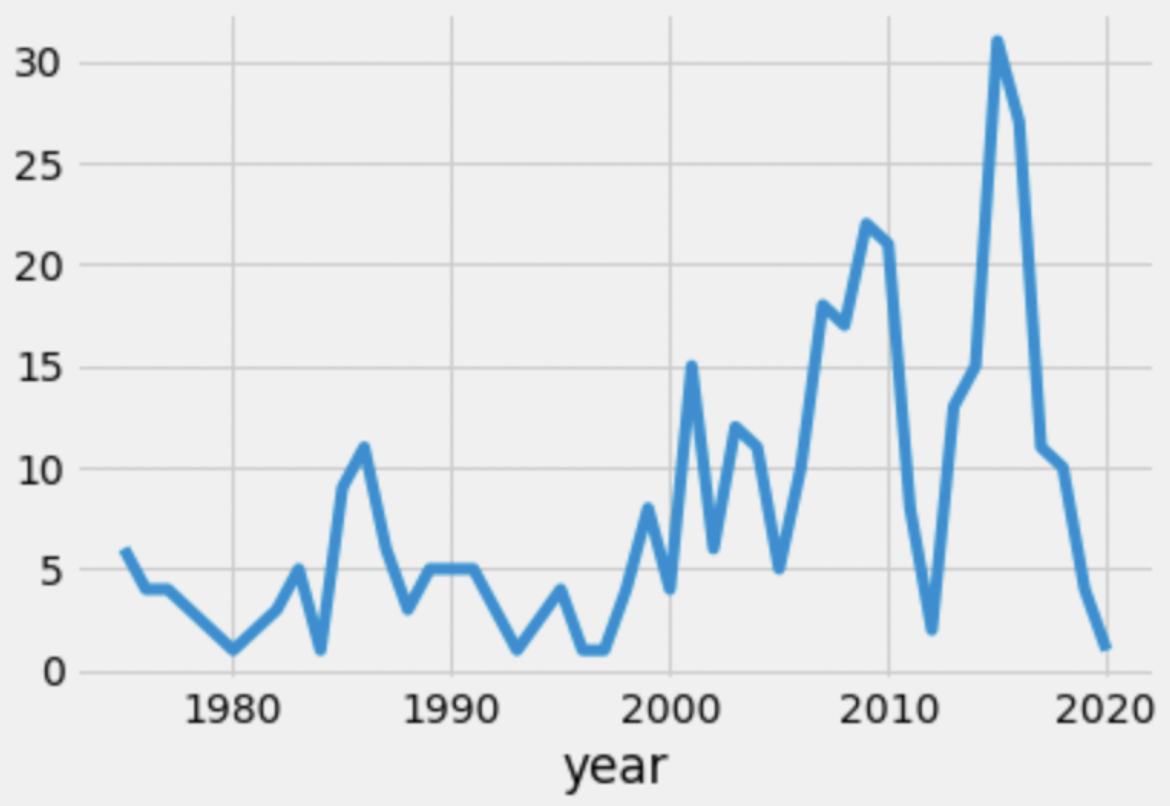
Which of the following is a valid conclusion we can make using this graph alone?
No city in the dataset had more skyscrapers built in 2015 than New York City.
The decrease in the number of skyscrapers built in 2012 over previous years was due to the 2008 economic recession, and the reason the decrease is seen in 2012 rather than 2008 is because skyscrapers usually take 4 years to be built.
The decrease in the number of skyscrapers built in 2012 over previous years was due to something other than the 2008 economic recession.
The COVID-19 pandemic is the reason that so few skyscrapers were built in 2020.
None of the above.
Answer: None of the above.
Let’s look at each answer choice.
Tip: This is a typical “cause-and-effect” problem that you’ll see in DSC 10 exams quite often. In order to establish that some treatment had an effect, we need to run a randomized controlled trial, or have some other guarantee that there is no difference between the naturally-observed control and treatment groups.
The average score on this problem was 90%.
In which of the following scenarios would it make sense to draw a overlaid histogram?
To visualize the number of skyscrapers of each material type, separately for New York City and Chicago.
To visualize the distribution of the number of floors per skyscraper, separately for New York City and Chicago.
To visualize the average height of skyscrapers built per year, separately for New York City and Chicago.
To visualize the relationship between the number of floors and height for all skyscrapers.
Answer: To visualize the distribution of the number of floors per skyscraper, separately for New York City and Chicago.
Recall, we use a histogram to visualize the distribution of a numerical variable. Here, we have a numerical variable (number of floors) that is split across two categories (New York City and Chicago), so we need to draw two histograms, or an overlaid histogram.
In the three incorrect answer choices, another visualization type is more appropriate. Given the descriptions here, see if you can draw what each of these three visualizations should look like.
The average score on this problem was 62%.
Billina Records, a new record company focused on creating new TikTok audios, has its offices on the 23rd floor of a skyscraper with 75 floors (numbered 1 through 75). The owners of the building promised that 10 different random floors will be selected to be renovated.
Below, fill in the blanks to complete a simulation that will estimate the probability that Billina Records’ floor will be renovated.
total = 0
repetitions = 10000
for i in np.arange(repetitions):
    choices = np.random.choice(__(a)__, 10, __(b)__)
    if __(c)__:
        total = total + 1
prob_renovate = total / repetitions
What goes in blank (a)?
np.arange(1, 75)
np.arange(10, 75)
np.arange(0, 76)
np.arange(1, 76)
What goes in blank (b)?
replace=True
replace=False
What goes in blank (c)?
choices == 23
choices is 23
np.count_nonzero(choices == 23) > 0
np.count_nonzero(choices) == 23
choices.str.contains(23)
Answer: np.arange(1, 76),
replace=False,
np.count_nonzero(choices == 23) > 0
Here, the idea is to randomly choose 10 different floors repeatedly, and each time, check if floor 23 was selected.
Blank (a): The first argument to np.random.choice needs
to be an array/list containing the options we want to choose from,
i.e. an array/list containing the values 1, 2, 3, 4, …, 75, since those
are the numbers of the floors. np.arange(a, b) returns an
array of integers spaced out by 1 starting from a and
ending at b-1. As such, the correct call to
np.arange is np.arange(1, 76).
Blank (b): Since we want to select 10 different floors, we need to
specify replace=False (the default behavior is
replace=True).
Blank (c): The if condition needs to check if 23 was one
of the 10 numbers that were selected, i.e. if 23 is in
choices. It needs to evaluate to a single Boolean value,
i.e. True (if 23 was selected) or False (if 23
was not selected). Let’s go through each incorrect option to see why
it’s wrong:
choices == 23, does not evaluate to a single
Boolean value; rather, it evaluates to an array of length 10, containing
multiple Trues and Falses.choices is 23, does not evaluate to what we
want – it checks to see if the array choices is the same
Python object as the number 23, which it is not (and will never be,
since an array cannot be a single number).np.count_nonzero(choices) == 23, does
evaluate to a single Boolean, however it is not quite correct.
np.count_nonzero(choices) will always evaluate to 10, since
choices is made up of 10 integers randomly selected from 1,
2, 3, 4, …, 75, none of which are 0. As such,
np.count_nonzero(choices) == 23 is the same as
10 == 23, which is always False, regardless of whether or
not 23 is in choices.choices.str.contains(23), errors, since
choices is not a Series (and .str can only
follow a Series). If choices were a Series, this would
still error, since the argument to .str.contains must be a
string, not an int.By process of elimination, Option 3,
np.count_nonzero(choices == 23) > 0, must be the correct
answer. Let’s look at it piece-by-piece:
choices == 23 is a Boolean array
that contains True each time the selected floor was floor
23 and False otherwise. (Since we’re sampling without
replacement, floor 23 can only be selected at most once, and so
choices == 23 can only contain the value True
at most once.)np.count_nonzero(choices == 23) evaluates to the number
of Trues in choices == 23. If it is positive
(i.e. 1), it means that floor 23 was selected. If it is 0, it means
floor 23 was not selected.np.count_nonzero(choices == 23) > 0 evaluates
to True if (and only if) floor 23 was selected.
The average score on this problem was 75%.
In the previous subpart of this question, your answer to blank (c)
contained the number 23, and the simulated probability was stored in the
variable prob_renovate.
Suppose, in blank (c), we change the number 23 to the number 46, and
we store the new simulated probability in the variable name
other_prob. (prob_renovate is unchanged from
the previous part.)
With these changes, which of the following is the most accurate
representation of the relationship between other_prob and
prob_renovate?
other_prob will be roughly half of
prob_renovate
other_prob will be roughly equal to
prob_renovate
other_prob will be roughly double
prob_renovate
Answer: other_prob will be roughly
equal to prob_renovate
The calculation we did in the previous subpart was not specific to the number 23. That is, we could have replaced 23 with any integer between 1 and 75 inclusive and the simulation would have been just as valid. The probability we estimated is the probability that any one floor was randomly selected; there is nothing special about 23.
(We say “roughly equal” because the result may turn out slightly different due to randomness.)
The average score on this problem was 89%.
While they are not skyscrapers, New Sixth College at UCSD has four relatively tall residential buildings, which we’ll call Building A, Building B, Building C, and Building D. Suppose each building has 10 floors.
Sixth College administration decides to ease the General Education requirements for a few randomly selected students. Here’s their strategy:
Everyone on one of the four floors selected in Wave 1 has the CAT 1 requirement waived. Everyone on the one floor selected in Wave 2 has both the CAT 1 and CAT 2 requirements waived.
Billy lives on the 8th floor of Building C. What’s the probability that Billy has both the CAT 1 and CAT 2 requirements waived? Give your answer as a proportion between 0 and 1, rounded to 3 decimal places.
Answer: 0.025
In order for the 8th floor of Building C to be selected, two things need to happen:
Since both events need to occur, and both events are independent (think of selecting in each wave as drawing names from a hat), the probability that both occur is the product of the probabilities that they occur individually:
\frac{1}{10} \cdot \frac{1}{4} = \frac{1}{40} = 0.025
The average score on this problem was 80%.
What’s the probability that at least one of the top (10th) floors of all four buildings are selected in Wave 1?
Give your answer as a proportion between 0 and 1, rounded to 3 decimal places.
Answer: 0.344
Whenever we are asked to compute the probability of “at least one” occurrence of some event, it is almost always easiest to compute the complement of (i.e. “1 minus”) the probability that there are no occurrences of the event. That is the case here; as such, we need to compute the probability that none of the 10th floors are selected across all four buildings.
To compute the probability that none of the 10th floors are selected across all four buildings, we first need to find the probability that the 10th floor is not selected in just a single building. This is 1 - \frac{1}{10} = \frac{9}{10}. Then, since the selections in each building are independent of other buildings, the probability that none of the 10th floors are selected across all four buildings is \left( \frac{9}{10} \right)^4.
Lastly, the probability we are asked for is the complement of the probability we just computed. So, the probability that at least one 10th floor is selected across all four buildings is
1 - \left( 1 - \frac{1}{10} \right)^4 = 1 - \left( \frac{9}{10} \right)^4 = 1 - 0.6561 = 0.3439
This rounds to 0.344.
The average score on this problem was 64%.