← return to practice.dsc10.com
Instructor(s): Janine Tiefenbruck
This exam was administered in-person. The exam was closed-notes, except students were provided a copy of the DSC 10 Reference Sheet. No calculators were allowed. Students had 50 minutes to take this exam.
Here’s a walkthrough video of some of the problems on the exam.
Tropical cyclones, such as hurricanes, are storms characterized by high wind speeds. These storms can cause great devastation when they make landfall. In the US, the National Hurricane Center (NHC) is the government entity responsible for tracking and predicting these tropical weather systems. The NHC names tropical storms of sufficient intensity, using a list of people’s names that gets reused every six years. For example, there have been many different storms named Cindy, all occurring in different years. We’ll assume that no tropical storm has ever spanned more than one calendar year.
The DataFrame storms contains information about all
named tropical storms in the Atlantic Ocean between 1965 and 2015. Each
row corresponds to a data entry describing the storm at a particular
moment in time, and one storm usually has many data entries throughout
the duration of the storm. The columns of storms are as
follows.
"Name" (str): The name of the storm."Date" (int): The year, month, and day of
the data entry, stored as an 8-digit integer. For example,
20151113 corresponds to November 13, 2015."Time" (str): The time of the data
entry."Status" (str): A categorical variable
describing the intensity of the storm at the time of the data entry.
There are many possible values, for example "TD" stands for
“tropical depression” and "TS" stands for “tropical
storm.”"Latitude" (str): The latitude of the
center of the storm at the time of the data entry. Describes the
north-south location of the storm."Longitude" (str): The longitude of the
center of the storm at the time of the data entry. Describes the
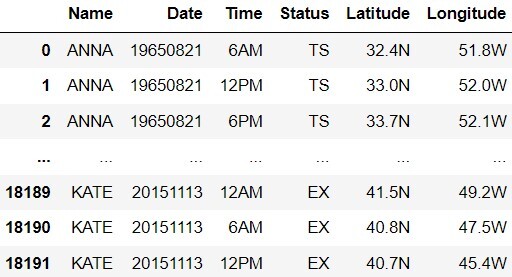
east-west location of the storm.A preview of storms is shown below.

Throughout this exam, we will refer to storms
repeatedly. Assume that we have already run
import babypandas as bpd and
import numpy as np.
Which column would be an appropriate index for storms?
'Name'
'Date'
'Time'
'Latitude'
None of these
Answer: None of these.
An index should be unique. In this case 'Name',
'Date', 'Time', and 'Latitude'
have repetative values, which does not make them
unique. Remember 'Name' will be reused every six years,
multiple hurricanes could happen on the same date, time, or
latitude.
The average score on this problem was 69%.
The "Date" column stores the year, month, and day
together in a single 8-digit int. The first four digits
represent the year, the next two represent the month, and the last two
represent the day. For example, 19500812 corresponds to
August 12, 1950. The get month function below takes one
such 8-digit int, and only returns the
month as an int. For example,
get month(19500812) evaluates to 8.
def get_month(date):
    return int((date % 10000) / 100)
Similarily, the get year and get day
functions below should each take as input an 8-digit int
representing a date, and return an int representing the
year and day, respectively. Choose the correct code to fill in the
blanks.
def get_year(date):
    return ____(a)____
def get_day(date):
return ____(b)____What goes in blank (a)?
date / 10000
int(date / 10000)
int(date % 10000)
int((date % 10000) / 10000)
Answer: int(date/10000)
The problem is asking us to find the code for blank (a) and
get_year is asking us to find the year. Let’s use
19500812 as an example, so we need to convert
19500812 to 1950. If we plug in Option 2
for (a) we will get 1950. This is because \frac{19500812}{10000} = 1950.0812, and when
int() is applied to 1950.0812 then it will drop the
decimal, which returns 1950.
Option A: date / 10000 If we plugged in
Option 1 into blank (a) we would get: \frac{19500812}{10000} = 1950.0812. This is a
float and is not equal to 1950.
Option C: int(date % 10000) If we
plugged in Option 3 into blank (a) we would get: 812. Remember,
% is the operation to find the remainder. We can manually
find the remainder by doing \frac{19500812}{10000} = 1950.0812, then
looking at the decimal, and noticing 812 cannot be divided by 10000
evenly. This is an int, but not the year.
Option D: int((date % 10000) / 10000)
If we plugged in Option 4 into blank (a) we would get: 0.0812. We get
this number by once again looking at the remainder of \frac{19500812}{10000} = 1950.0812, which is
812, and then dividing 812 by 10000. This is a float and is not equal to
1950.
The average score on this problem was 67%.
What goes in blank (b)?
int(date / 100)
int(date / 1000000)
int((date % 100) / 10000)
date % 100
Answer: date % 100
The problem is asking us to find the code for blank (b) and
get_day is asking us to get the day. Let’s use
19500812 as the example again, so we need to convert
19500812 to 12. Remember, % is the operation
to find the remainder. If we plug in Option 4 for (b)
we will get 12. This is because \frac{19500812}{100} = 195008.12 and by
looking at the decimal place we notice 12 cannot be divided by 100
evenly, making the remainder 12.
Option 1: int(date / 100) If we plugged
in Option 1 into blank (b) we would get 195008. This is because Python
would do: \frac{19500812}{100} =
195008.12 then would drop the decimal due to the
int() function. This is not the day.
Option 2: int(date / 1000000) If we
plugged in Option 2 into blank (b) we would get 19. This is because
Python would do: \frac{19500812}{1000000} =
19.500812 then would drop the decimal due to the
int() function. This is a day, but not the one we
are looking for.
Option 3: int((date % 100) / 10000) If
we plugged in Option 3 into blank (b) we would get 0. This is because
Python works from the inside out, so it will first evaluate the
remainder: \frac{19500812}{100} =
195008.12, by looking at the decimal place we notice 12 cannot be
divided by 100 evenly, making the remainder 12. Python then does \frac{12}{10000} = 0.0012. Remember that
int() drops the decimal, so by plugging a date into this
code it will return 0, which is not a day.
The average score on this problem was 56%.
Important! For the rest of the exam, assume those
three functions have been implemented correctly and the following code
has been run to assign three new columns to storms.
storms = storms.assign(Year = storms.get("Date").apply(get_year),
                       Month = storms.get("Date").apply(get_month),
Day = storms.get("Date").apply(get_day))The DataFrame amelia was created by the code below, and
is shown in its entirety.
amelia = (storms[(storms.get("Name") == "AMELIA") &
         (storms.get("Year") == 1978)]
         .get(["Year", "Month", "Day", "Time",
         "Status", "Latitude", "Longitude"]))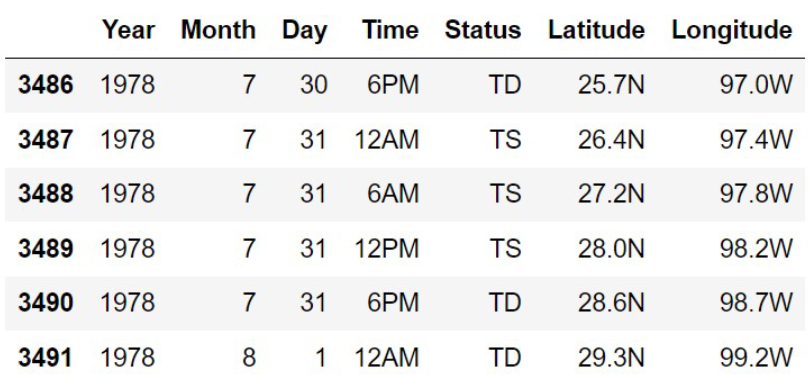
Use the space provided to show the DataFrame that results from
amelia.groupby("Status").max()The column labels should go in the top row, and the row labels (index) should go in the leftmost row. You may not need to use all the rows and columns provided.

Answer:
| Status | Year | Month | Day | Time | Latitude | Longtitude |
|---|---|---|---|---|---|---|
| TD | 1978 | 8 | 31 | 6pm | 29.3N | 99.2W |
| TS | 1978 | 7 | 31 | 6am | 28.0N | 98.2W |
Remember that calling .groupby('column name') sets the
column name to the index. This means the 'Status' column
will become the new bolded index, which is found in the leftmost column
of the data frame. Another thing to know is Python will organize strings
in the index in alphabetical order, so for example
TS and TD both start with T, but
D comes sooner in the alphabet than S, which
makes row TD come before row
TS.
Next it is important to look at the .max(), which tells
us that we want the maximum element of each column that correspond to
the unique 'Status'. Recall how .max()
interacts with strings: .max() will organize strings in the
columns in descending order, so the last alphabetically/numerically.
The average score on this problem was 59%.
Suppose there are n different storms included in
storms. Say we create a new DataFrame from
storms by adding a column called 'Duration'
that contains the number of minutes since the first data entry for that
storm, as an int. The first few rows of this new DataFrame
are shown below.

Next we sort this DataFrame in ascending order of
'Duration' and save the result as
storms_by_duration. Which of the following statements must
be true? Select all that apply.
The first n rows of storms_by_duration will
all correspond to different storms, because they will contain the first
reading from each storm in the data set.
The last n rows of storms_by_duration will
all correspond to different storms, because they will contain the last
reading from each storm in the data set.
storms_by_duration will contain exactly n rows.
len(storms_by_duration.take(np.arange(n)).get("Name").unique())
will evaluate to n.
Answer: “The first n rows of
storms_by_duration will all correspond to different storms,
because they will contain the first reading from each storm in the data
set.”
Let’s first analyze the directions. According to the directions, we
added the column 'Duration', so we know how long each storm
lasted. Then we sorted the DataFrame in ascending order, which will put
the storms with the shortest duration at the top.
Each row will be tied to a unique storm because each storm can only
have one minimum. This means storms_by_duration’s first
n rows will contain the shortest duration for each unique
storm, which corresponds to the first option.
Option 2: This is incorrect because even though the
DataFrame is sorted in ascending order it is possible for a storm to
have multiple close values in 'Duration', which does not
guarantee unique storms in the last n rows. For example if
you had the storm 'alice', which one time had a duration of
60 and the longest duration of 62. The values will be sorted such that
60 will come before 62, but they are within the last n
values of the DataFrame, causing 'alice' to appear
twice.
Option 3: This is incorrect because there can be
more than n rows. It is possible that a storm appears
multiple times. For example the storm Anna occured three
different times on August 21, 1965 without sorting.
Option 4: This is incorrect. The code written will
take the first n rows of the table, get the names, and find
the number of unique named storms. Names are not unique, so it is
possible for the storms to share the same name. This can be seen in the
DataFrame example above.
The average score on this problem was 66%.
Latitude measures distance from the equator in the North or South direction. Longitude measures distance from the prime meridian in the East or West direction.
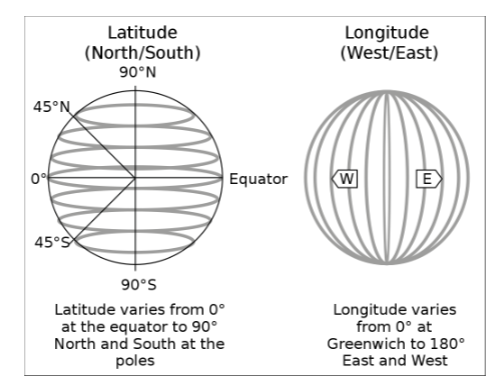
Since all of the United States lies north of the equator and west of
the prime meridian, the last character of each string in the
"Latitude" column of storms is
"N", and the last character of each string in the
"Longitude" column is "W". This means that we
can refer to the latitude and longitude of US locations by their
numerical values alone, without the directions "N" and
"W". The map below shows the latitude and longitude of the
continental United States in numerical values only.
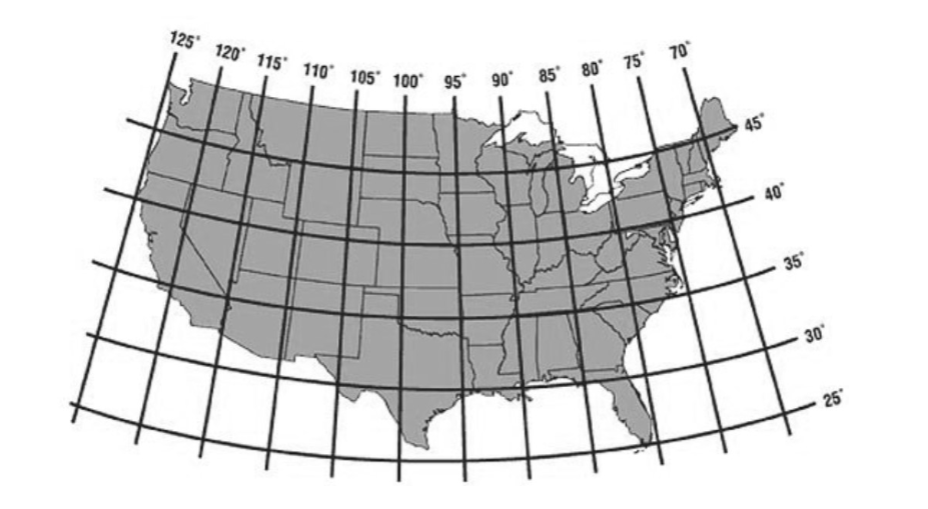
lat_long_numerical that takes as
input a string representing a value from either the
"Latitude" or "Longitude" column of
storms, and returns that latitude or longitude as a
float. For example, lat_long_numerical(34.1N)
should return 34.1. def lat_long_numerical(lat_long):
return ________Hint: The string method .strip() takes as input
a string of characters and removes all instances of those characters at
the beginning and end of the string. For example,
"www.dsc10.com".strip("cmowz.") evaluates to
"dsc10".
What goes in the blank? To earn credit, your answer
must use the string method: .strip().
Answer: float(lat_long.strip("NW"))
According to the hint, .strip() takes as input of a
string of characters and removes all instances of those characters at
the beginning or the end of the string. The input we are given,
lat_long is the latitude and longitude, so we able to take
it and use .strip() to remove the "N" and
"W". However, it is important to mention the number we now
have is still a string, so we put float() around it to
convert the string to a float.
The average score on this problem was 70%.
Assume that lat_long_numerical has been correctly
implemented. Which of the following correctly replaces the strings in
the 'Latitude' and 'Longitude' columns of
storms with float values? Select all that
apply.
Option 1:
    lat_num = storms.get('Latitude').apply(lat_long_numerical)
    long_num = storms.get('Longitude').apply(lat_long_numerical)
    storms = storms.drop(columns = ['Latitude', 'Longitude'])
    storms = storms.assign(Latitude = lat_num, Longitude = long_num)
Option 2:
    lat_num = storms.get('Latitude').apply(lat_long_numerical)
    long_num = storms.get('Longitude').apply(lat_long_numerical)
    storms = storms.assign(Latitude = lat_num, Longitude = long_num)
    storms = storms.drop(columns = ['Latitude', 'Longitude'])
Option 3:
    lat_num = storms.get('Latitude').apply(lat_long_numerical)
    long_num = storms.get('Longitude').apply(lat_long_numerical)
    storms = storms.assign(Latitude = lat_num, Longitude = long_num)
Option 1
Option 2
Option 3
Answer: Option 1 and Option 3
Option 1 is correct because it applies the function
lat_long_numerical to the 'Latitude' and
'Longitude' columns. It then drops the old
'Latitude' and 'Longitude' columns. Then
creates new 'Latitude' and 'Longitude' columns
that contain the float versions.
Option 3 is correct because it applies the function
lat_long_numerical to the 'Latitude' and
'Longitude' columns. It then re-assigns the
'Latitude' and 'Longitude' columns to the
float versions.
Option 2 is incorrect because it re-assigns the
'Latitude' and 'Longitude' columns to the
float versions and then drops the 'Latitude' and
'Longitude' columns from the DataFrame.
The average score on this problem was 86%.
Important! For the rest of the exam, assume that the
'Latitude' and 'Longitude' columns of storms
now have numerical entries.
Storm forecasters are very interested in the direction in which a
tropical storm moves. This direction of movement can be determined by
looking at two consecutive rows in storms that correspond
to the same storm.
The function direction takes as input four values: the
latitude and longitude of a data entry for one storm, and the latitude
and longitude of the next data entry for that same storm. The function
should return the direction in which the storm moved in the period of
time between the two data entries. The return value should be one of the
following strings:
"NE" for Northeastern movement,"NW" for Northwestern movement,"SW" for Southwestern movement, or"SE" for Southeastern movement
For example, direction(23.1, 75.1, 23.4, 75.7) should
return "NW". If the storm happened to move
directly North, South, East, or West, or if the storm did not
move at all, the function may return any one of "NE",
"NW", "SW", or "SE". Fill in the
blanks in the function direction below. It may help to
refer to the images on Page 5.
def direction(old_lat, old_long, new_lat, new_long):
    if old_lat > new_lat and old_long > new_long:
        return ____(a)____
    elif old_lat < new_lat and old_long < new_long:
        return ____(b)____
    elif old_lat > new_lat:
        return ____(c)____
    else:
        return ____(d)____
What goes in blank (a)?
"NE"
"NW"
"SW"
"SE"
Answer: "SE"
According to the given example that
direction(23.1, 75.1, 23.4, 75.7) should return
"NW", we learn that having an old_lat <
new_lat (in the example: 23.1
< 23.4) causes for the storm to move North and that having a
old_long < new_long (in the example: 75.1 < 75.7) causes for the storm to move
West. This tells us if old_lat > new_lat
then the storm will move South, the opposite direction of North, and if
old_long > new_long then the storm will
move East, the opposite direction of West.
The if statement is looking for the direction where
(old_lat > new_lat and
old_long > new_long), so from above we can
tell it is moving Southeast. Remember both conditions must be satisfied
for this if statement to execute.
The average score on this problem was 73%.
What goes in blank (b)?
"NE"
"NW"
"SW"
"SE"
Answer: "NW"
Recall from the previous section the logic that:
old_lat < new_latold_lat > new_latold_long > new_longold_long < new_longThis means we are looking for the directions that satisfy the
elif statement: old_lat < new_lat and
old_long < new_long. Looking at our logic the statement
is satisfied by the direction Northwest.
The average score on this problem was 79%.
What goes in blank (c)?
"NE"
"NW"
"SW"
"SE"
Answer: "SW"
We know the answers cannot be 'SE' or 'NW'
because the if statement and elif statement above the one we are
currently working in will catch those. This tells us we are either
working with 'SW' or 'NE'. From the logic we
established in the previous subparts we know when 'old_lat'
> 'new_lat' we know the storm is going in the Southern
direction. This means the only possible answer is 'SW'.
The average score on this problem was 65%.
What goes in blank (d)?
"NE"
"NW"
"SW"
"SE"
Answer: "NE"
The only option we have left is 'NE'. Remember than
Python if statements will run every single if, and if none
of them are triggered then it will move to the elif
statements, and if none of those are triggered then it will finally run
the else statement. That means whatever direction not used
in parts a, b, and c needs to be used here.
The average score on this problem was 61%.
The most famous Hurricane Katrina took place in August, 2005. The
DataFrame katrina_05 contains just the rows of
storms corresponding to this hurricane, which we’ll call
Katrina’05.
Fill in the blanks in the code below so that
direction_array evaluates to an array of directions (each
of which is"NE", "NW", "SW", or
"SE") representing the movement of Katrina ’05 between each
pair of consecutive data entries in katrina_05.
    direction_array = np.array([])
    for i in np.arange(1, ____(a)____):
        w = katrina_05.get("Latitude").____(b)____
        x = katrina_05.get("Longitude").____(c)____
        y = katrina_05.get("Latitude").____(d)____
        z = katrina_05.get("Longitude").____(e)____
        direction_array = np.append(direction_array, direction(w, x, y, z))
What goes in blank (a)?
Answer: katrina_05.shape[0]
In this line of code we want to go through the entire Katrina’05
DataFrame. We are provided the inclusive start, but we need to find the
exclusive stop, which would be the number of rows in the DataFrame.
katrina_05.shape[0] takes the DataFrame, finds the shape,
which is represented by: (rows, columns), and then isolates
the rows in the first index.
The average score on this problem was 46%.
What goes in blank (b)?
Answer: iloc[i-1]
In this line of code we want to find the latitude of the row we are
in. The whole line of code:
katarina_05.get("Latitude").iloc[i-1] isolates the column
'Latitude' and uses iloc, which is a purely
integer-location based indexing function, to select the element at
position i-1. The reason we are doing i-1 is
because the for loop started an np.array at 1. For example,
if we wanted the latitude at index 0 we would need to do
iloc[1-1] to get the equivalent iloc[0].
The average score on this problem was 37%.
What goes in blank (c)?
Answer: iloc[i-1]
Similarily to part b, this line of code will find the longitude of
the row we are in. The whole line of code:
katarina_05.get("Longitude").iloc[i-1] isolates the column
'Longitude' and uses iloc, which is a purely
integer-location based indexing function, to select the element at
position i-1. The reason we are doing i-1 is
because the for loop started an np.array at 1.
The average score on this problem was 36%.
What goes in blank (d)?
Answer: iloc[i]
Now we are trying to find the “next” latitude, which will be the next
coordinate point that the storm Katrina moved to. This
means we want to find the latitude after the one we
found in part b. The whole line of code:
katarina_05.get("Latitude").iloc[i] isolates the
"Latitude" column, and uses iloc to choose the
element at position i. Recall, the for loop starts at 1, so
it will always be the “next” element comparatively to part b, where we
substracted 1.
The average score on this problem was 37%.
What goes in blank (e)?
Answer: iloc[i]
Similarily to part d, we are trying to find the “next” longitude,
which will be the next coordinate point that the storm
Katarina moved to. This means we want to find the longitude
after the one we found in part c. The whole line of
code: katarina_05.get("Longitude").iloc[i] isolates the
column 'Longitude' and uses iloc to choose the
element at position i. Recall, the for loop starts at 1, so
it will always be the “next” element comparitively to part c, where we
substracted 1.
The average score on this problem was 37%.
Now we want to use direction_array to find the number of
times that Katrina ’05 changed directions, or moved in a different
direction than it was moving immediately prior. For example, if
direction_array contained values "NW",
"NE", "NE", "NE",
"NW", we would say that there were two direction changes
(once from "NW" to "NE", and another from
"NE" to "NW"). Fill in the blanks so that
direction_changes evaluates to the number of times that
Katrina ’05 changed directions.
    direction_changes = 0
    for j in ____(a)____:
        if ____(b)____:
            direction_changes = direction_changes + 1
What goes in blank (a)?
Answer:
np.arange(1, len(direction_array))
We want the for loop to execute the length of the given
direction_array because we compare all of the directions
inside of it. The line of code:
np.arange(1, len(direction_array)) will create an array
that is as large as the direction_array, which allows us to
use j to access different indexes inside of
direction_array.
The average score on this problem was 36%.
What goes in blank (b)?
Answer:
direction_array[j] != direction_array[j-1]
We want to increase direction_changes whenever there is
a switch between directions. This means we want to see if
direction_array[j] is not equal to
direction_array[j-1].
It is important to look at how the for loop is running
because it starts at 1 and ends at len(direction_array) - 1
(this is because np.arange has an exclusive stop). Let’s
say we wanted to compare the direction at index 5 and index 4. We can
easily get the element at index 5 by doing
direction_array[j] and then get the element at index 4 by
doing direction_array[j-1]. We can then check if they are
not equal to each other by using the !=
operation.
When the if statement activates it will then update the
direction_changes
The average score on this problem was 64%.
There are 34 rows in katrina_05. Based on this
information alone, what is the maxi- mum possible value of
direction_changes?
Answer: 32
Note: The maximum amount of direction changes would mean that every other direction would be different from each other.
It is also important to remember what we are feeding
into direction_changes. We are feeding in the output from
direction_array from Problem 7. Due to the
for-loops throughout this section we can see the maximum
amount of changes by 2. Once in direction_array and once in
direction_changes.
For a more visual explanation, let’s imagine katrina_05
has these values:
[(7, 3), (6, 4), (9, 2), (8, 7), (3, 5)]
We would then feed this into Problem 7’s direction_array
to get an array that looks like this:
["NE", "SW", "SE", "NW"]
Finally, we will feed this array into direction_changes.
We can see that there are three changes: one from "NE" to
"SW", one from "SW" to "SE", and
one from "SE" to "NW".
This means that the maximum amount of direction_changes
is 34-1-1 = 32. We subtract 1 for each
step in the process because we lose a value due to the
for-loops.
The average score on this problem was 36%.
The DataFrame directors contains historical information about the director of the National Hurricane Center (NHC). A preview of directors is shown below.
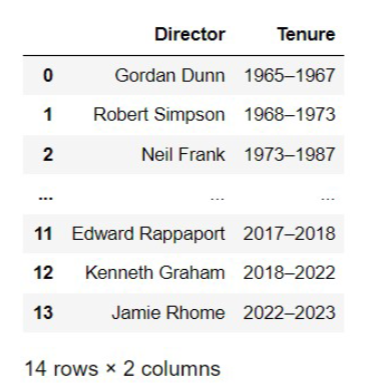
We would like to merge storms with
directors to produce a DataFrame with the same information
as storms plus one additional column with the name of the
director who was leading the NHC at the time of each storm. However,
when we try to merge with the command shown below, Python fails to
produce the desired DataFrame.
directors.merge(storms, left_on="Tenure", right_on="Year")Which of the following is a problem with our attempted merge? Select all that apply.
We cannot merge these two DataFrames because they have two completely different sets of column names.
We want to add information about the directors to storms, so we need
to use storms as our left DataFrame. The command should start with
storms.merge(directors).
The directors DataFrame does not contain enough
information to determine who was the director of the NHC at the time of
each storm.
The "Tenure" column of directors contains a different
data type than the "Year" column of storms.
Answer: Option 3 and Option 4
Recall that
left_df.merge(right_df, left_on='column_a', right_on='column_b')
merges left_df to the right_df and specifies
which columns from the DataFrame to use as keys by using
left_on= and right_on=. This means that
column_a becomes the key for the left DataFrame and
column_b becomes the key for the right DataFrame. That
means the column names do not need to be the same. The important part of
this is 'column_a' and 'column_b' should be
the same data type and contain the same information for the merge to be
successful.
Option 4 is correct because the years are formatted differenntly in
storms and in directors. In
storms the column "Year" contains an int,
which is the year, whereas in "Tenure" the column contains
a string to represent a span of years. When we try to merge there is no
overlap between values in these columns. There will actually be an error
because we are trying to merge two columns of different types.
Option 3 is correct because the merge will fail to happen due to the error we see caused by the columns containing values with no overlap.
Option 1: Is incorrect because you can merge
DataFrames with different column names using left_on and
right_on.
Option 2: Is incorrect because regardless of the
left or right DataFrames if done correctly
they will merge together. This means the order of the DataFrames does
not make an impact.
The average score on this problem was 61%.
Recall that all the named storms in storms occurred
between 1965 and 2015, a fifty-year time period.
Below is a histogram and the code that produced it. Use it to answer the questions that follow.
    (storms.groupby(["Name", "Year"]).count()
        .reset_index()
        .plot(kind="hist", y="Year",
            density=True, ec="w",
            bins=np.arange(1965, 2020, 5)));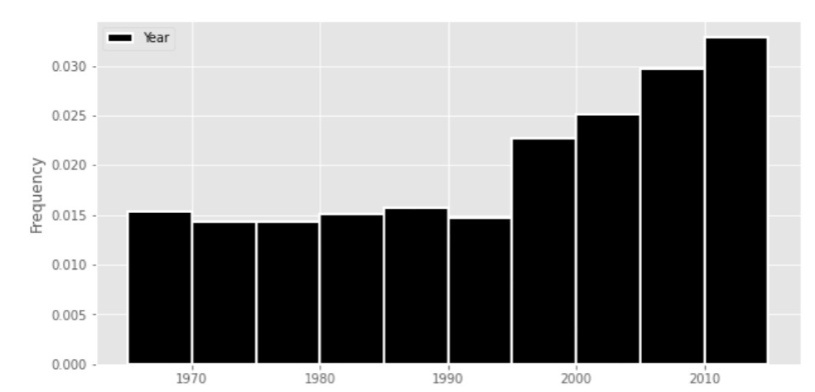
Approximately (a) percent of named storms in this fifty-year time period occurred in 1995 or later. Give your answer to the nearest multiple of five.
Answer: 55
We can find the percentage of named storms by using the fact: a histograms’ area is always normalized to 1. This means we can calculate the area of the rectangle, also known as width * height, to the left of 1995. The height, which is the frequency, is about 0.015 and the width is the difference between 1995 and 1965. This gives us: 1 - (1995 - 1965) * 0.015 = 0.55. Next to convert this to a percentage we multiply by 100, giving us: 0.55 * 100 = 55\%.
The average score on this problem was 52%.
True or False? The line plot generated by the code below will have no downward-sloping segments after 1995.
    (storms.groupby(["Name", "Year"]).count()
        .reset_index()
        .groupby("Year").count()
        .plot(kind="line", y="Name");
True
False
Answer: False
The previous histogram shows upward-sloping segments for each 5-year period after 1995; however, we are now ploting a line graph that shows a continuous timeline. Thus, there may be downward-sloping that happens within any 5-year periods.
The average score on this problem was 51%.
The code below defines a variable called
month formed.
month_formed = (storms.groupby(["Name", "Year"]).min()
                      .reset_index()
                      .groupby("Month").count()
                      .get("Name"))
What is the data type of month formed?
int
str
Series
Dataframe
None of these
Answer: Series
It’s helpful to analyze the code piece by piece. The first part is
doing .groupby(["Name", "Year"]).min(), which will index
both "Name" and "Year" and find the minimum
values in the DataFrame. We are still working with a DataFrame at this
point. The next part .reset_index() makes
"Name" and "Year" columns again. Again, this
is a DataFrame. The next part .groupby("Month").count()
makes "Month" the index and gets the count for each element
in the DataFrame. Finally, .get("Name") isolates the
"Name" column and returns to month_formed a
series.
The average score on this problem was 81%.
Which of the following expressions evaluates to the proportion of storms in our data set that were formed in August?
month_formed.loc[8]/month_formed.sum()
month_formed.iloc[7]/month_formed.sum()
month_formed[month_formed.index == 8].shape[0]/month_formed.sum()
month_formed[month_formed.get("Month") == 8].shape[0]/month_formed.sum()
Answer:
month_formed.loc[8]/month_formed.sum()
Option 1: Recall that August is the eigth month, so
using .loc[8] will find the label 8 in
month_formed, which will be counts or the
number of storms formed in August. Dividing the number of storms formed
in August by the total number of storms formed will give us the
proportion of storms that formed in August.
Option 2: It is important to realize that the months
have become the index of month_formed, but that doesn’t
necessarily mean that the index starts in January or that there have
been storm during a month before August. For example if there were no
storms in March then there would be no 3 in the index. Recall
.iloc[7] is indexing for whatever is in position 7, but
because the index is not guaranteed we cannot be certain the
.iloc[7] will return August.
Option 3: The code:
month_formed[month_formed.index == 8].shape[0] will return
1. Finding the index at month 8 will give us August, but doing
.shape[0] gives us the number of rows in August, which
should only be 1 because of groupby. This means that Option
3’s line of code will not give us the number of storms that formed in
August, which makes it impossible to find the propotion.
Option 4: Remember that months_formed’s
index is "Month". This means that there is no column
"Month", so the code will error, meaning it cannot give us
proportions of storms that formed in August.
The average score on this problem was 35%.
Hurricane forecasters use complex models to simulate hurricanes.
Suppose a forecaster simulates 10,000 hurricanes and keeps track of the
state where each hurricane made landfall in an array called
landfalls. Each element of landfalls is a
string, which is either the full name of a US state or the string
"None" if the storm did not hit land in the simulation.
The forecaster wants to use the results of their simulation to
estimate the probability that a given storm hits Georgia. Write one line
of Python code that approximates this probability, using the data in
landfalls.
Answer:
np.count_nonzero(landfalls == "Georgia") / 10000
The probability would be the number of times the storm hit Georgia
over the total number of simulated hurricanes, which is 10000. Since
each element of landfills is a string, we can use
np.count_nonzero() to give us all of the times the storm
hits Georgia in the simulation. Recall np.count_nonzero()
determines whether the elements are “truthy”, so if the String was equal
to "Georgia" then it would be counted, and otherwise would
be ignored. Then to calculate the probability we simply divide the
number of times the storm hit Georgia by 10000.
The average score on this problem was 34%.
Oh no, a hurricane is forming! Experts predict that the storm has a 45% chance of hitting Florida, a 25% chance of hitting Georgia, a 5% chance of hitting South Carolina, and a 25% chance of not making landfall at all.
Fast forward: the storm made landfall. Assuming the expert predictions were correct, what is the probability that the storm hit Georgia? Give your answer as a fully simplified fraction between 0 and 1.
Hint: The answer is not \frac{1}{4}, or 25%.
Answer:
Originally, we were unsure if the hurricane would make landfall. Now that it has our total percentage has changed: 100\% - 25\% = 75\%. Remember probability should always add up to 100%. So our new total is 75%. We can calculate the probability that a storm hits Georgia by doing: \frac{25\%}{75\%} = \frac{1}{3}.
The average score on this problem was 36%.