← return to practice.dsc10.com
This quiz was administered in-person. It was closed-book and
closed-note; students were not allowed to use the DSC
10 Reference Sheet. Students had 20 minutes to work on
the quiz.
This quiz covered Lectures 21-24 of the Winter 2024 offering
of DSC 10.
Note (groupby / pandas 2.0): Pandas 2.0+ no longer
silently drops columns that can’t be aggregated after a
groupby, so code written for older pandas may behave
differently or raise errors. In these practice materials we use
.get() to select the column(s) we want after
.groupby(...).mean() (or other aggregations) so that our
solutions run on current pandas. On real exams you will not be penalized
for omitting .get() when the old behavior would have
produced the same answer.
It can be hard to find a parking spot on UCSD’s campus! The
parking DataFrame contains UCSD parking occupancy data for
two on-campus parking structures. The "Structure" column
contains either "Gilman" or "Hopkins". Each
row of parking represents one day. The
"Occupancy" column contains a float representing the
proportion of occupied spaces at noon on that day. We’ll use this data
to test the following hypotheses:
Null Hypothesis: At noon, Gilman and Hopkins are equally occupied. The observed differences in our samples are simply due to random chance.
Alternative Hypothesis: At noon, Hopkins is less occupied than Gilman. The observed differences in our samples cannot be explained by random chance alone.
As our test statistic, we will use the mean noontime
"Occupancy" of Hopkins minus the mean noontime
"Occupancy" of Gilman.
Suppose the Series s is defined as below. Write an
expression involving s that evaluates to the observed value
of the test statistic, and store the result in
observed.
    s = parking.groupby("Structure").mean().get("Occupancy")
    observed = ______
What goes in the blank?
Answer:
s.loc["Hopkins"] - s.loc["Gilman"]
The average score on this problem was 61%.
In running the permutation test, we need to do a simulation that runs
many times, using a for-loop. What should be the first
thing we do inside the for-loop?
Initialize an empty array to store our results.
Define a variable for the number of repetitions.
Permute one of the columns of parking.
Calculate the difference in group means.
Answer: Permute one of the columns of
parking.
The average score on this problem was 79%.
Suppose we store 5000 simulated test statistics in the array
differences. Choose the appropriate symbol to fill in the
calculation of the p-value below.
p_value = np.count_nonzero(differences ______ observed) / 5000 <
<=
==
!=
>
>=
Answer: <=
The average score on this problem was 65%.
Suppose the p-value of our test is 0.01 and we are testing the hypotheses at the 0.05 significance level. Which hypothesis is better supported by the data?
Null
Alternative
Answer: Alternative
The average score on this problem was 93%.
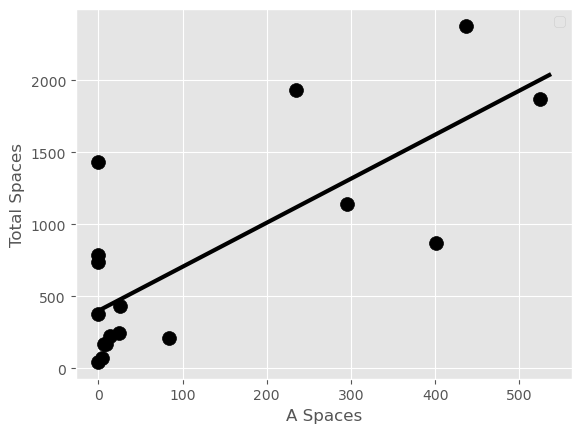
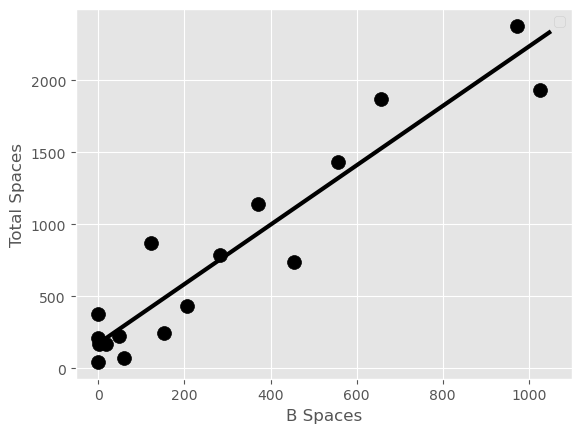
UCSD’s parking lots include A spaces for faculty, B spaces for staff, and S spaces for students.
The scatter plot on the left shows the relationship between the number of A spaces and the total number of parking spaces in each region of campus. Similarly, the scatter plot on the right shows the relationship between the number of B spaces and the total number of parking spaces in each region of campus. Note that these numbers represent a count of parking spaces existing on campus, and have nothing to do with occupancy.
Based on these scatter plots, which pair of variables has a larger correlation coefficient?
A Spaces and Total Spaces
B Spaces and Total Spaces
Answer: B Spaces and Total Spaces
The average score on this problem was 86%.
Which of the following variables would most likely be negatively associated with the total number of spaces in a campus region?
Total area of the campus region
Number of athletic fields in the campus region
Number of residents in the campus region
Number of electric vehicle charging stations in the campus region
Answer: Number of athletic fields in the campus region
The average score on this problem was 73%.
The number of S spaces and the total number of parking spaces in each campus region are linearly related with a correlation coefficient of 0.6. The number of S spaces in the Warren College region of campus is 5 standard deviations below average. What does the regression line predict for the number of total spaces in Warren College, measured in standard units?
Answer: -3
The average score on this problem was 64%.
True or False: Since number of parking spaces is always a positive integer, the regression line that predicts the total number of spaces from the number of S spaces must have a positive y-intercept.
True
False
Answer: False
The average score on this problem was 64%.