← return to practice.dsc10.com
This quiz was administered in-person. Students were allowed a
double-sided sheet of handwritten notes. Students had 20
minutes to work on the quiz.
This quiz covered Lectures
22-25 of the Winter 2025 offering
of DSC 10.
Note (groupby / pandas 2.0): Pandas 2.0+ no longer
silently drops columns that can’t be aggregated after a
groupby, so code written for older pandas may behave
differently or raise errors. In these practice materials we use
.get() to select the column(s) we want after
.groupby(...).mean() (or other aggregations) so that our
solutions run on current pandas. On real exams you will not be penalized
for omitting .get() when the old behavior would have
produced the same answer.
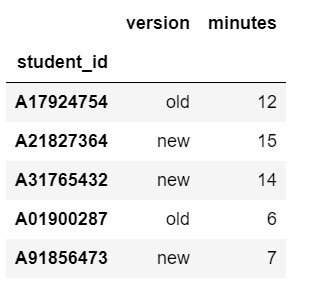
UCSD is testing whether a new version of the TritonLink website will improve student engagement. Each student who visits the Tritonlink website receives either the old version or the new version at random, and the number of minutes spent on the site is recorded.
The results of the experiment are stored in the DataFrame
tritonlink, whose first few rows are shown at right.
Let’s do a permutation test with the following hypotheses:
Null Hypothesis: The amount of time students spend on the TritonLink website is the same for both versions of the website.
Alternative Hypothesis: Students spend more time on the new version of the site.
For our test statistic, we’ll use the mean time spent on the new version of the site minus the mean time spent on the old version of the site. The function below should compute one simulated difference of this statistic under the null hypothesis.
def one_stat():
    shuffled = np.random.permutation(__(a)__)
    shuffled_df = tritonlink.assign(shuffled = shuffled)
    grouped = shuffled_df.groupby(__(b)__).mean().get("minutes")
    return __(c)__
(i) Which of the following statements about blank (a) is
correct?
We can shuffle either "minutes" or
"version" because it doesn’t matter which column we shuffle
in a permutation test.
We must shuffle "minutes" because only numerical data
can be shuffled in a permutation test.
We must shuffle "version" because only group labels can
be shuffled in a permutation test.
We must shuffle "minutes" because of the structure of
the provided code.
We must shuffle "version" because of the structure of
the provided code.
(ii) Fill in blanks (b) and (c).
(i): Option E
(ii):
(b): "shuffled"
(c):
grouped.loc["new"] - grouped.loc["old"]
The average score on this problem was 61%.
Suppose we complete our permutation test and calculate a p-value. Which of the following statements are true? Select all that apply.
If the p-value is 0.18, this means that if the alternative hypothesis is true, the probability of seeing a difference as or more extreme as the observed difference is about 18\%.
If the p-value is 0.03, this means that if the null hypothesis is true, the probability of seeing a difference as or more extreme as the observed difference is about 3\%.
If the p-value is 0, this means that we implemented our permutation test incorrectly.
If the p-value is 0.5, this means that exactly half of the simulated test statistics were less extreme than our observed difference.
None of the above.
Answer: Options 2 and 4
The average score on this problem was 75%.
For the DataFrame df shown in full below, both the
"x" and "y" columns have a mean of 0 and a
standard deviation of 1. Calculate the correlation between
"x" and "y".
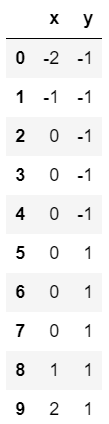
Answer: 0.6
The average score on this problem was 48%.
UCSD uses a system called EASy for students to submit requests for enrollment if they need an exception to the enrollment requirements. Naturally, bigger classes generally receive more EASy requests.
Suppose the average number of seats per class (x) is 75, with a standard deviation of 25, and the average number of EASy requests per class (y) is 10, with a standard deviation of 4.
For this subpart only, suppose the correlation between x and y is 0.5. Use the regression line to predict the number of EASy requests for a class with 100 seats. Give your answer as an integer.
Answer: 12
The average score on this problem was 67%.
A Japanese class has 150 seats and receives 16 EASy requests. Say we use linear regression to predict the number of EASy requests from the number of seats, and find that the squared residual for this Japanese class is 4. What is the smallest possible correlation between x and y in this case? Give your answer as a simplified fraction.
Answer: 1/3
The average score on this problem was 36%.