← return to practice.dsc10.com
This quiz was administered in-person. Students were allowed a
double-sided sheet of handwritten notes. Students had 30
minutes to work on the quiz.
This quiz covered Lectures
1-6 of the Winter
2026 offering of DSC 10.
Note (groupby / pandas 2.0): Pandas 2.0+ no longer
silently drops columns that can’t be aggregated after a
groupby, so code written for older pandas may behave
differently or raise errors. In these practice materials we use
.get() to select the column(s) we want after
.groupby(...).mean() (or other aggregations) so that our
solutions run on current pandas. On real exams you will not be penalized
for omitting .get() when the old behavior would have
produced the same answer.
You are working as a student assistant in the UCSD Registrar’s Office, and your job is to analyze enrollment data to understand student preferences and improve course scheduling.
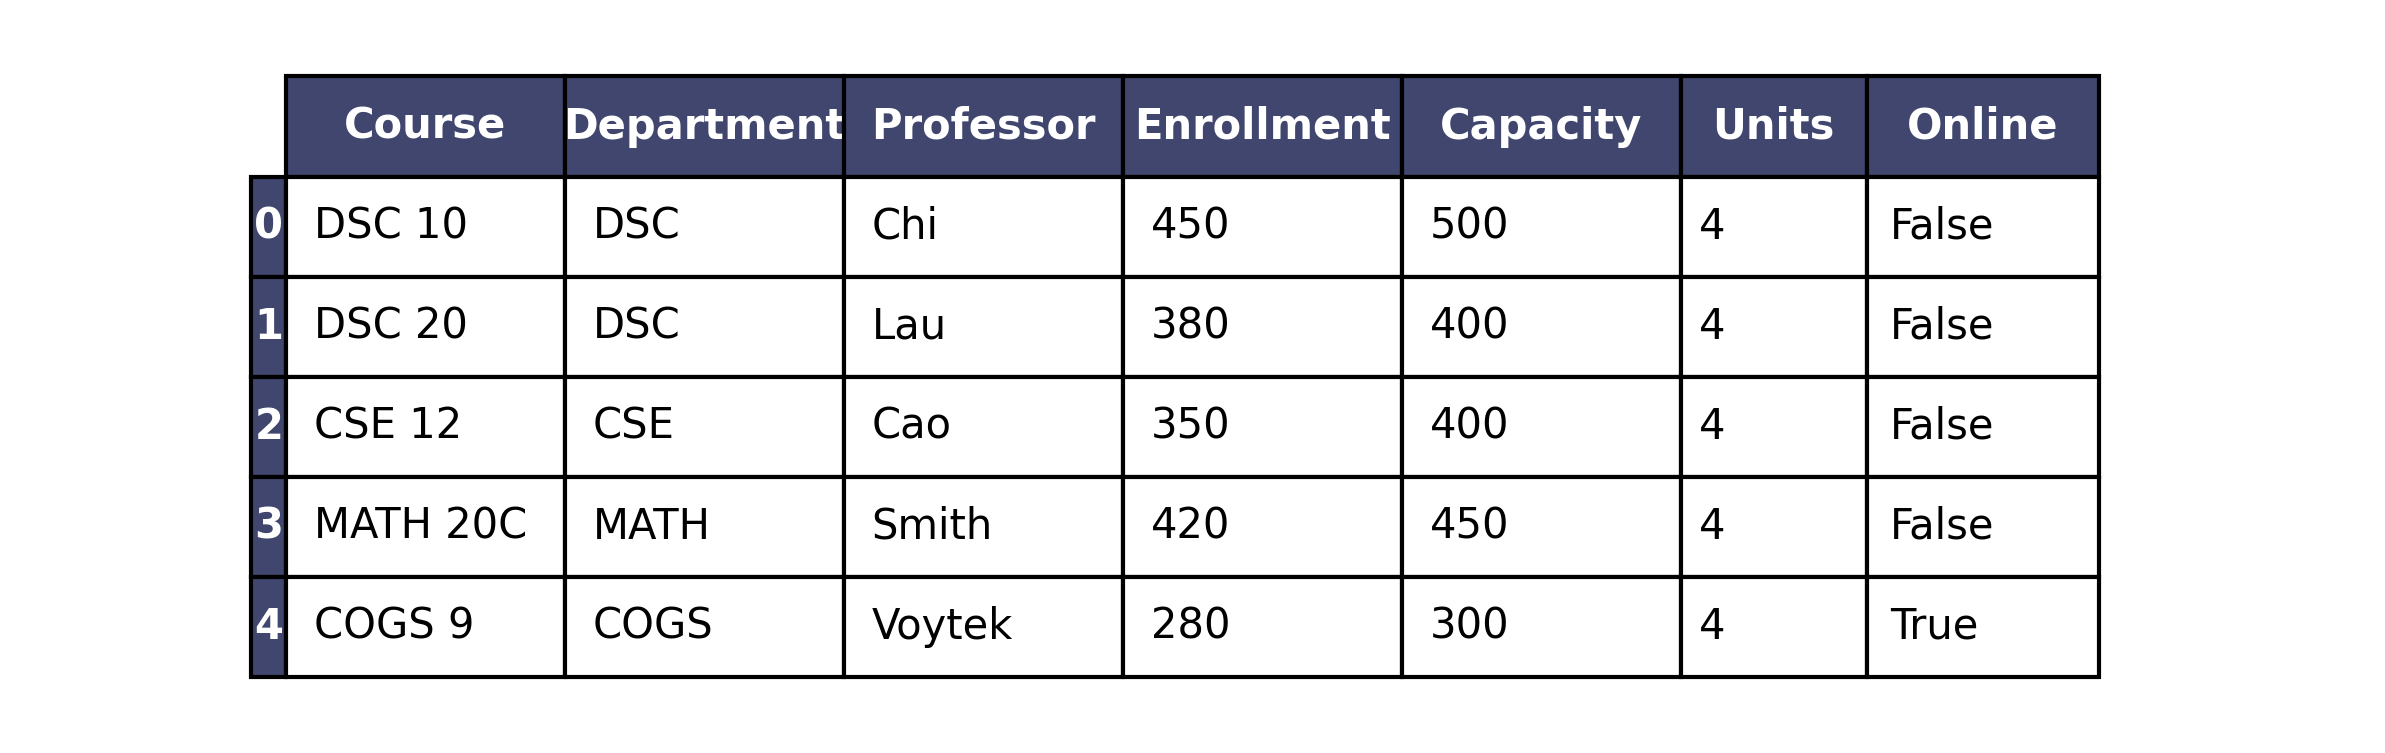
The courses DataFrame (first few rows are shown below)
contains information about courses offered this quarter. Each row
represents a unique course offering. For each course, you have the
"Course" code (str), "Department"
(str), "Professor" name (str),
"Enrollment" (int), "Capacity"
(int), "Units" (int), and whether
the course is "Online" (bool).
Assume that we have already run import babypandas as bpd
and import numpy as np.
Your supervisor asks you to create a welcome message for new
students. The code below generates this message and stores it in the
variable message. In the box, write in the value of the
message variable after the code executes. Write
clearly!
school = "ucsd"
year = "2026"
message = "hello"
message = school.upper() + " " + year
message = message.replace("SD", " San Diego")Answer: "UC San Diego 2026"
Trace through each line:
school = "ucsd", year = "2026",
message = "hello".message = school.upper() + " " + year.
school.upper() is "UCSD". Concatenating gives
"UCSD" + " " + "2026" → "UCSD 2026".message.replace("SD", " San Diego") replaces
the substring "SD" inside "UCSD 2026" with
" San Diego" (note the leading space in the replacement
string), yielding "UC San Diego 2026".
The average score on this problem was 86%.
For each expression below, write the output that Python produces, or write error if the expression produces an error.
str(courses.take(np.arange(4)).shape[0]) * 2Answer: "44"
courses.take(np.arange(4)) keeps the first four rows, so
.shape[0] is 4. Then str(4) is
"4", and "4" * 2 repeats the string twice →
"44".
The average score on this problem was 58%.
courses.get("Enrollment").iloc[0] != courses.get("Enrollment").loc[0]Answer: False
.iloc[0] and .loc[0] both refer to the
first row (label 0), so they read the same enrollment
value. Comparing a value to itself with != is always
False (e.g. 120 != 120).
The average score on this problem was 40%.
courses.shape[1] / 7Answer: 1.0
courses.shape[1] is the number of columns, which is
7 for this DataFrame. So 7 / 7 is
1.0 (division in Python 3 returns a float; 1.
is also acceptable).
The average score on this problem was 78%.
The Registrar wants to calculate what percentage of each course’s
capacity is currently filled. Fill in the blanks to add a new column
called "Percent_Full" to the courses DataFrame
that contains this percentage (as a number between 0 and 100).
courses = courses.assign(Percent_Full = ___(a)___ / ___(b)___ * 100)(a):
Answer: courses.get("Enrollment") —
current enrollment in each row (numerator of the fraction).
The average score on this problem was 86%.
(b):
Answer: courses.get("Capacity")
Percent full is (enrollment ÷ capacity) × 100. Blank (a) is current enrollment per row; blank (b) is max capacity per row. Division is element-wise (row by row), then multiply by 100. For example, 120 enrolled and 150 capacity gives (120/150) × 100 = 80.
The average score on this problem was 86%.
With more students requesting online courses, the Registrar wants to
know how many online courses are offered by the CSE department.
Select all expressions that correctly evaluate to an
int that is the total number of online CSE courses in
courses.
courses[(courses.get("Department") == "CSE") & (courses.get("Online"))]
courses.groupby("Department").sum().get("Online").loc["CSE"]
((courses.get("Department") == "CSE") & (courses.get("Online"))).shape[0]
((courses.get("Department") == "CSE") & (courses.get("Online"))).sum()
None of the above.
Answer: Select
courses.groupby("Department").sum().get("Online").loc["CSE"]
and
((courses.get("Department") == "CSE") & (courses.get("Online"))).sum().
We need an int equal to the number of
courses that are both CSE and online.
int.groupby("Department").sum() aggregates;
for boolean columns, .sum() counts
True values.
.get("Online").loc["CSE"] is the count of online courses in
CSE — an integer. Correct.((...) & (...)) is a boolean Series
with one entry per row; .shape[0] is the
length of that Series (total number of courses), not
how many are True. Incorrect.True values (online CSE rows).
Correct.
The average score on this problem was 52%.
For a report to the Academic Senate, you need to analyze course enrollment patterns. Write or finish one line of Python code that produces each quantity described.
(a) A DataFrame consisting of
"Department" as the index, and a single
column containing the mean "Enrollment" of all
courses within each "Department".
courses.get(["Department", "Enrollment"]).___________________________Answer: groupby("Department").mean() —
full one-liner:
courses.get(["Department", "Enrollment"]).groupby("Department").mean()
Explanation: .get(["Department", "Enrollment"]) keeps
only those columns. .groupby("Department") groups rows by
department. .mean() computes the mean of numeric columns
per group — here mean "Enrollment" — producing a DataFrame
with "Department" as the index and one column of means.
The average score on this problem was 78%.
(b) A scatter plot of the data in the
courses DataFrame with "Capacity" on the
x-axis and "Enrollment" on the y-axis.
Answer:
courses.plot(kind="scatter", x="Capacity", y="Enrollment")
kind="scatter" draws a scatter plot; x and
y name the columns for the horizontal and vertical
axes.
The average score on this problem was 79%.