
← return to practice.dsc10.com
Instructor(s): Suraj Rampure, Puoya Tabaghi, Janine Tiefenbruck
This exam was administered in-person. The exam was closed-notes, except students were provided a copy of the DSC 10 Reference Sheet. No calculators were allowed. Students had 50 minutes to take this exam.
Note (groupby / pandas 2.0): Pandas 2.0+ no longer
silently drops columns that can’t be aggregated after a
groupby, so code written for older pandas may behave
differently or raise errors. In these practice materials we use
.get() to select the column(s) we want after
.groupby(...).mean() (or other aggregations) so that our
solutions run on current pandas. On real exams you will not be penalized
for omitting .get() when the old behavior would have
produced the same answer.
Here’s a walkthrough video of some of the problems on the exam.
In September 2020, Governor Gavin Newsom announced that by 2035, all new vehicles sold in California must be zero-emissions vehicles. Electric vehicles (EVs) are among the most popular zero-emissions vehicles (though other examples include plug-in hybrids and hydrogen fuel cell vehicles).
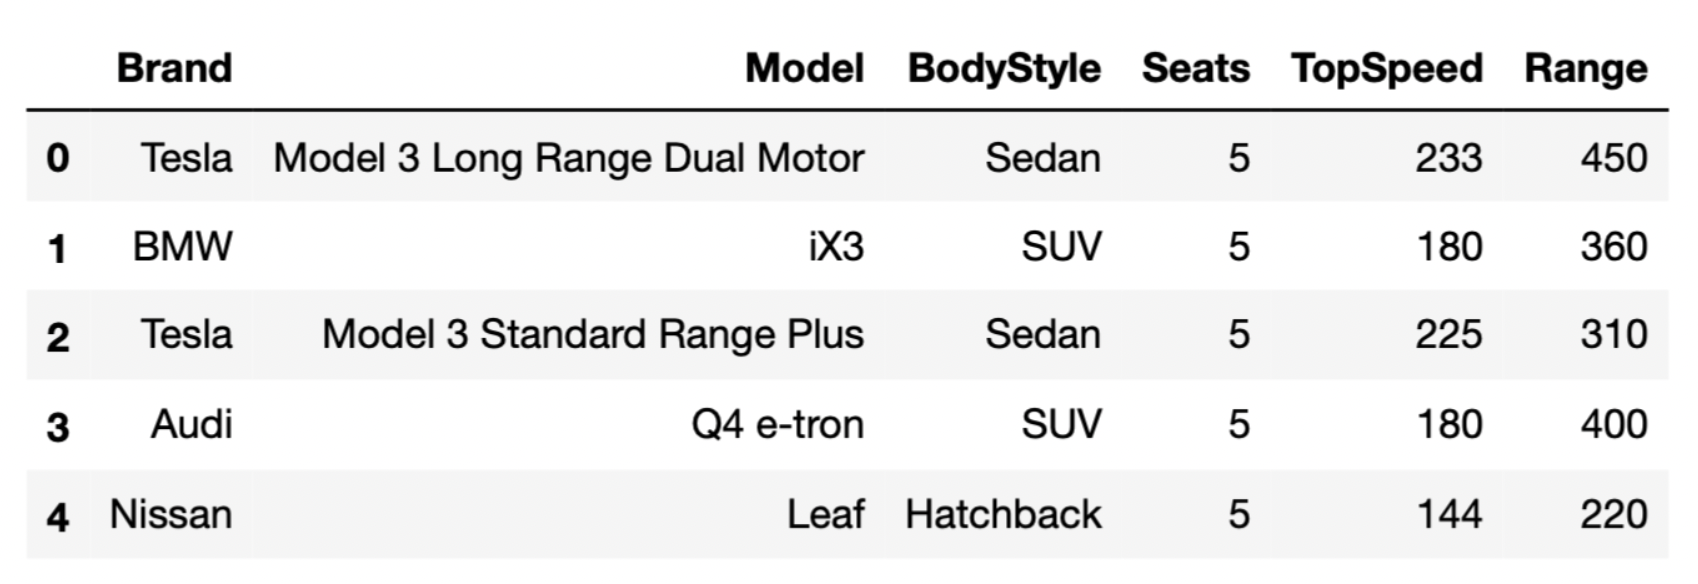
The DataFrame evs consists of 32 rows,
each of which contains information about a different EV model.
"Brand" (str): The vehicle’s manufacturer."Model" (str): The vehicle’s model name."BodyStyle" (str): The vehicle’s body style."Seats" (int): The vehicle’s number of seats."TopSpeed" (int): The vehicle’s top speed, in
kilometers per hour."Range" (int): The vehicle’s range, or distance it can
travel on a single charge, in kilometers.The first few rows of evs are shown below (though
remember, evs has 32 rows total).
Throughout this exam, we will refer to evs
repeatedly.
Assume that:
"Brand" column are
"Tesla", "BMW", "Audi", and
"Nissan".import babypandas as bpd and
import numpy as np.Tip: Open this page in another tab, so that it is easy to refer to this data description as you work through the exam.
Note: This problem is out of scope; it covers material no longer included in the course.
TritonTire, a UCSD alumni-run car repair shop, has an electronic database of all services it has ever provided, dating back to 1987. The owner, Dasha, says:
Our collective records from all 50 states show that, over the years, our repair shops have performed more and more repairs on EVs. After discussing this with our employees, we believe this is because newer EVs are not made to the same standards as the gasoline cars before them.
In at most two sentences, identify the largest confounding factor that Dasha has not considered in her argument. Your answer must fit in the box below.
Answer: The confounding factor that Dasha hasn’t considered is the prevalence of EVs. There are a lot more EVs now than ever before, so even if EVs are made to the same standards as gasoline cars or better, we’d expect to see more repairs of EVs now.
The average score on this problem was 68%.
Which type of visualization should we use to visualize the
distribution of "Range"?
Bar chart
Histogram
Scatter plot
Line plot
Answer: Histogram
"Range" is a numerical (i.e. quantitative) variable, and
we use histograms to visualize the distribution of numerical
variables.
"Range" is not
categorical."Range").
The average score on this problem was 63%.
Teslas, on average, tend to have higher "Range"s than
BMWs. In which of the following visualizations would we be able to see
this pattern? Select all that apply.
A bar chart that shows the distribution of "Brand"
A bar chart that shows the average "Range" for each
"Brand"
An overlaid histogram showing the distribution of
"Range" for each "Brand"
A scatter plot with "TopSpeed" on the x-axis and "Range" on the y-axis
Answer:
"Range" for each
"Brand""Range" for each "Brand"Let’s look at each option more closely.
Option 1: A bar chart showing the distribution
of "Brand" would only show us how many cars of each
"Brand" there are. It would not tell us anything about the
average "Range" of each "Brand".
Option 2: A bar chart showing the average range
for each "Brand" would help us directly visualize how the
average range of each "Brand" compares to one
another.
Option 3: An overlaid histogram, although
perhaps a bit messy, would also give us a general idea of the average
range of each "Brand" by giving us the distribution of the
"Range" of each brand. In the scenario mentioned in the
question, we’d expect to see that the Tesla distribution is further
right than the BMW distribution.
Option 4: A scatter plot of
"TopSpeed" against "Range" would only
illustrate the relationship between "TopSpeed" and
"Range", but would contain no information about the
"Brand" of each EV.
The average score on this problem was 91%.
Gabriel thinks "Seats" is a categorical variable because
it can be used to categorize EVs by size. For instance, EVs with 4 seats
are small, EVs with 5 seats are medium, and EVs with 6 or more seats are
large.
Is Gabriel correct?
Yes
No
Justify your answer in one sentence. Your answer must fit in the box below.
Answer: No
"Seats" is a numerical variable, since it makes sense to
do arithmetic with the values. For instance, we can find the average
number of "Seats" that a group of cars has. Gabriel’s
argument could apply to any numerical variable; just because we can
place numerical variables into “bins” doesn’t make them categorical.
The average score on this problem was 51%.
Suppose we’ve run the following two lines of code.
first = evs.get("Brand").apply(max)
second = evs.get("Brand").max()
Note:
v is defined as
len(v), unless v is a DataFrame, in which case
its length is v.shape[0].s is a string, then max(s) also
evaluates to a string.Fill in the blanks: first is a __(i)__ of length
__(ii)__.
(i):
list
array
string
DataFrame
Series
(ii): _____
Answer:
The .apply method applies a function on every element of
a Series. Here, evs.get("Brand").apply(max) applies the
max function on every element of the "Brand"
column of evs, producing a new Series with the same length
as evs.
While not necessary to answer the question, if s is a
string, then max(s) evaluates to the single character in
s that is last in the alphabet. For instance,
max("zebra") evaluates to "z". As such,
evs.get("Brand").apply(max) is a Series of 32 elements,
each of which is a single character, corresponding to the latest
character in the alphabet for each entry in
evs.get("Brand").
The average score on this problem was 65%.
Fill in the blanks: second is a __(i)__ of length
__(ii)__.
(i):
list
array
string
DataFrame
Series
(ii): _____
Answer:
The .max() method will find the “largest” element in the
Series it is called in, which in this case is
evs.get("Brand"). The way that strings are ordered is
alphabetically, so evs.get("Brand").max() will be the last
value of "Brand" alphabetically. Since we were told that
the only values in the "Brand" column are
"Tesla", "BMW", "Audi", and
"Nissan", the “maximum” is "Tesla", which has
a length of 5.
The average score on this problem was 54%.
Suppose we’ve run the following line of code.
counts = evs.groupby("Brand").count()What value does counts.get("Range").sum() evaluate
to?
Answer: 32
counts is a DataFrame with one row per
"Brand", since we grouped by "Brand". Since we
used the .count() aggregation method, the columns in
counts will all be the same – they will all contain the
number of rows in evs for each "Brand"
(i.e. they will all contain the distribution of "Brand").
If we sum up the values in any one of the columns in
counts, then, the result will be the total number of rows
in evs, which we know to be 32. Thus,
counts.get("Range").sum() is 32.
The average score on this problem was 56%.
What value does counts.index[3] evaluate to?
Answer: "Tesla"
Since we grouped by "Brand" to create
counts, the index of counts will be
"Brand", sorted alphabetically (this sorting happens
automatically when grouping). This means that counts.index
will be the array-like sequence
["Audi", "BMW", "Nissan", "Tesla"], and
counts.index[3] is "Tesla".
The average score on this problem was 33%.
Consider the following incomplete assignment statement.
result = evs______.mean()In each part, fill in the blank above so that result evaluates to the specified quantity.
A DataFrame, indexed by "Brand", whose
"Seats" column contains the average number of
"Seats" per "Brand". (The DataFrame may have
other columns in it as well.)
Answer: .groupby("Brand")
When we group by a column, the resulting DataFrame contains one row
for every unique value in that column. The question specified that we
wanted some information per "Brand", which implies
that grouping by "Brand" is necessary.
After grouping, we need to use an aggregation method. Here, we wanted
the resulting DataFrame to be such that the "Seats" column
contained the average number of "Seats" per
"Brand"; this is accomplished by using
.mean(), which is already done for us.
Note: With the provided solution, the resulting DataFrame also has
other columns. For instance, it has a "Range" column that
contains the average "Range" for each "Brand".
That’s fine, since we were told that the resulting DataFrame may have
other columns in it as well. If we wanted to ensure that the only column
in the resulting DataFrame was "Seats", we could have used
.get(["Brand", "Seats"]) before grouping, though this was
not necessary.
The average score on this problem was 76%.
A number, corresponding to the average "TopSpeed" of all
EVs manufactured by Audi in evs
Answer:
[evs.get("Brand") == "Audi"].get("TopSpeed")
There are two parts to this problem:
Querying, to make sure that we only keep the rows corresponding to Audis. This is accomplished by:
evs.get("Brand") == "Audi" to create a Boolean
Series, with Trues for the rows we want to keep and
Falses for the other rows.True. This is accomplished by
evs[evs.get("Brand") == "Audi"] (though the
evs part at the front was already provided).Accessing the "TopSpeed" column. This is
accomplished by using .get("TopSpeed").
Then, evs[evs.get("Brand") == "Audi"].get("TopSpeed") is
a Series contaning the "TopSpeed"s of all Audis, and mean
of this Series is the result we’re looking for. The call to
.mean() was already provided for us.
The average score on this problem was 77%.
A number, corresponding to the average of the natural logarithm of
the "TopSpeed" of all EVs in evs. (Hint: The function
np.log computes the natural logarithm of a single
number.)
Answer:
.get("TopSpeed").apply(np.log)
The .apply method is used to apply a function on every
element of a Series. The relevant Series here is the column containing
the "TopSpeed" of each EV,
i.e. evs.get("TopSpeed") (the evs part was
already provided to us).
After we get that Series, we need to use the function
np.log on every element of it. This is accomplished by
using .apply(np.log). Putting our steps so far together, we
have evs.get("TopSpeed").apply(np.log), which is a Series
containing the natural logarithm of the "TopSpeed" of all
EVs in evs.
The number we were asked for was the average of the natural logarithm
of the "TopSpeed" of all EVs in evs; all we
need to do now is use the .mean() method at the end, which
was already done for us.
The average score on this problem was 61%.
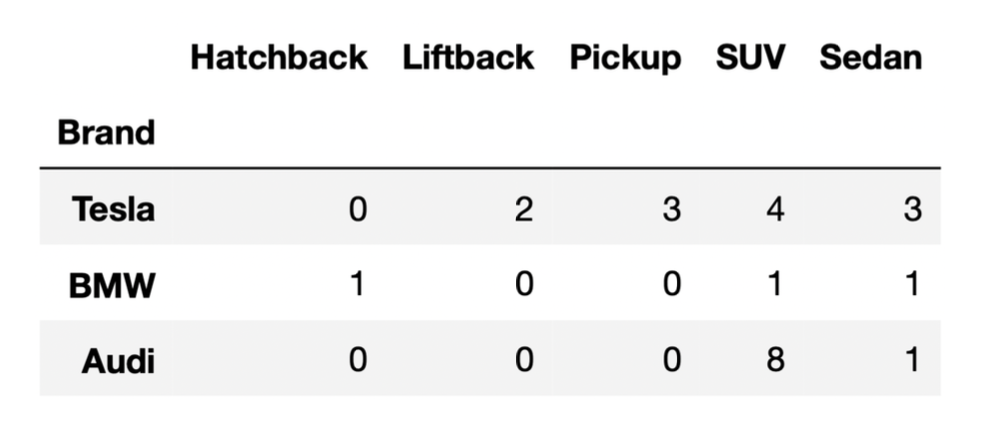
The DataFrame below shows the distribution of
"BodyStyle" for all "Brands" in
evs, other than Nissan. We will call EVs made by a
"Brand" other than Nissan “non-Nissan EVs”; there are 24
non-Nissan EVs in evs.
Use the information above to answer the following questions.
Suppose we randomly select one of the non-Nissan EVs and it is either
an SUV or a sedan. What is the most likely "Brand" of the
randomly selected non-Nissan EV?
Tesla
BMW
Audi
Answer: Audi
Let’s compute the number of EVs that are either SUVs or sedans for each non-Nissan Brand. (To do this, we’ll look at the right-most two columns in the DataFrame provided.)
Since Audi is the "Brand" with the most total SUVs and
sedans, it is the most likely "Brand" to be selected.
Note: You could compute conditional probabilities for each
brand, if you’d like, by dividing the counts above by 18 (the total
number of SUVs and sedans). For instance, P(\text{EV is a BMW given that EV is an SUV or
sedan}) = \frac{2}{18}. The "Brand" with the highest
count (Audi, with 9 SUVs or sedans) is also the "Brand"
with the highest conditional probability of being selected given that
the selected car is an SUV or sedan (Audi, with \frac{9}{18}).
The average score on this problem was 88%.
Suppose we randomly select two of the non-Nissan EVs without replacement. The probability that both are BMWs is equal to \frac{1}{k} , where k is a positive integer. What is k?
8
56
64
84
92
108
Answer: 92
In the first selection, the probability of selecting a BMW is \frac{1+1+1}{24} = \frac{3}{24} (3 is the total number of EVs that are BMW, and 24 is the total number of non-Nissan EVs as given by the question).
In the second selection, since we select without replacement, there are only 23 EVs we can select from. Given that in the first selection we already selected 1 BMW, there are only 2 BMWs left among the 23 EVs left. Thus, the probability of getting a BMW in the second selection is \frac{2}{23}.
Putting this all together, the probability that both selections are BMWs is
\frac{3}{24}\cdot\frac{2}{23} = \frac{6}{24} \cdot \frac{1}{23} =\frac{1}{4} \cdot \frac{1}{23} = \frac{1}{92}
So, k = 92.
The average score on this problem was 67%.
Suppose we randomly select one of the non-Nissan EVs and it is an SUV. What is the probability that it is made by Tesla? Give your answer as a simplified fraction.
Answer: \frac{4}{13}
The question is asking for the proportion of SUVs that are made by Tesla.
We first need to find the number of SUVs in the DataFrame provided, which is 4 + 1 + 8 = 13. Of those 13 SUVs, 4 are made by Tesla. Thus, the proportion of SUVs made by Tesla is \frac{4}{13}, so the probability that a randomly selected SUV is made by Tesla is \frac{4}{13}.
The average score on this problem was 66%.
Below, we provide the same DataFrame as shown at the start of the previous problem, which contains the distribution of “BodyStyle” for all “Brands” in evs, other than Nissan.
Suppose we’ve run the following few lines of code.
tesla = evs[evs.get("Brand") == "Tesla"]
bmw = evs[evs.get("Brand") == "BMW"]
audi = evs[evs.get("Brand") == "Audi"]

combo = tesla.merge(bmw, on="BodyStyle").merge(audi, on="BodyStyle")
How many rows does the DataFrame combo have?
21
24
35
65
72
96
Answer: 35
Let’s attempt this problem step-by-step. We’ll first determine the
number of rows in tesla.merge(bmw, on="BodyStyle"), and
then determine the number of rows in combo. For the
purposes of the solution, let’s use temp to refer to the
first merged DataFrame,
tesla.merge(bmw, on="BodyStyle").
Recall, when we merge two DataFrames, the resulting
DataFrame contains a single row for every match between the two columns,
and rows in either DataFrame without a match disappear. In this problem,
the column that we’re looking for matches in is
"BodyStyle".
To determine the number of rows of temp, we need to
determine which rows of tesla have a
"BodyStyle" that matches a row in bmw. From
the DataFrame provided, we can see that the only
"BodyStyle"s in both tesla and
bmw are SUV and sedan. When we merge tesla and
bmw on "BodyStyle":
tesla each match the 1 SUV row in
bmw. This will create 4 SUV rows in temp.tesla each match the 1 sedan row in
bmw. This will create 3 sedan rows in
temp.So, temp is a DataFrame with a total of 7 rows, with 4
rows for SUVs and 3 rows for sedans (in the "BodyStyle")
column. Now, when we merge temp and audi on
"BodyStyle":
temp each match the 8 SUV rows in
audi. This will create 4 \cdot 8
= 32 SUV rows in combo.temp each match the 1 sedan row in
audi. This will create 3 \cdot 1
= 3 sedan rows in combo.Thus, the total number of rows in combo is 32 + 3 = 35.
Note: You may notice that 35 is the result of multiplying the
"SUV" and "Sedan" columns in the DataFrame
provided, and adding up the results. This problem is similar to Problem 5 from the Fall 2021
Midterm.
The average score on this problem was 45%.
TritonTrucks is an EV startup run by UCSD alumni. Their signature EV, the TritonTruck, has a subpar battery (the engineers didn’t pay attention in their Chemistry courses).
A new TritonTruck’s battery needs to be replaced after 500 days, unless it fails first, in which case it needs to be replaced immediately. On any given day, the probability that a given TritonTruck’s battery fails is 0.02, independent of all other days.
Fill in the blanks so that
average_days_until_replacement is an estimate of the
average number of days a new TritonTruck’s battery lasts without
needing to be replaced.
def days_until_replacement(daily_conditions):
    days = 0
    for i in __(a)__:
        if daily_conditions[i] == True:
            __(b)__
        else:
            return days
    return days

total = 0
repetitions = 10000
for i in np.arange(repetitions):
    # The first element of the first argument to np.random.choice is
    # chosen with probability 0.98
    daily_conditions = np.random.choice(__(c)__, 500, p=[0.98, 0.02])
    total = total + days_until_replacement(daily_conditions)
average_days_until_replacement = total / repetitions
What goes in blanks (a), (b), and (c)?
Answer:
np.arange(len(daily_conditions))days = days + 1[True, False]At a high-level, here’s how this code block works:
daily_conditions is an array of length 500, in each
each element is True with probability 0.98 and
False with probability 0.02. Each element of
daily_conditions is meant to represent whether or not the
given TritonTruck’s battery failed on that day. For instance, if the
first four elements of daily_conditions are
[True, True, False, True, ...], it means the battery was
fine the first two days, but failed on the third day.days_until_replacement takes in
daily_conditions and returns the number of days until the
battery failed for the first time. In other words, it returns the number
of elements before the first False in
daily_conditions. In the example above, where the first
four elements of daily_conditions are
[True, True, False, True, ...],
days_until_replacement would return 2, since the battery
lasted 2 days until it needed to be replaced. It doesn’t matter what is
in daily_conditions after the first
False.With that in mind, let’s fill in the pieces.
Blank (a): We need to loop over all elements in
daily_conditions. There are two ways to do this, in theory
– by looping over the elements themselves
(e.g. for cond in daily_conditions) or their positions
(e.g. for i in np.arange(len(daily_conditions))). However,
here we must loop over their positions, because the body of
days_until_replacement uses
daily_conditions[i], which only makes sense if
i is the position of an element in
daily_conditions. Since daily_conditions has
500 elements, the possible positions are 0, 1, 2, …, 499. Since
len(daily_conditions) is 500, both
np.arange(len(daily_conditions)) and
np.arange(500) yield the same correct result here.
Blank (b): days is the “counter” variable that is
being used to keep track of the number of days the battery lasted before
failing. If daily_conditions[i] is True, it
means that the battery lasted another day without failing, and so 1
needs to be added to days. As such, the correct answer here
is days = days + 1 (or days += 1). (If
daily_conditions[i] is False, then the battery
has failed, and so we return the number of days until the first
failure.)
Blank (c): This must be [True, False], as mentioned
above. There are other valid answers too, including
np.array([True, False]) and [1, 0].
The average score on this problem was 56%.
Histograms A and B below both display the distribution of the
"Seats" column, using different bins. Each histogram
includes all 32 rows of evs.
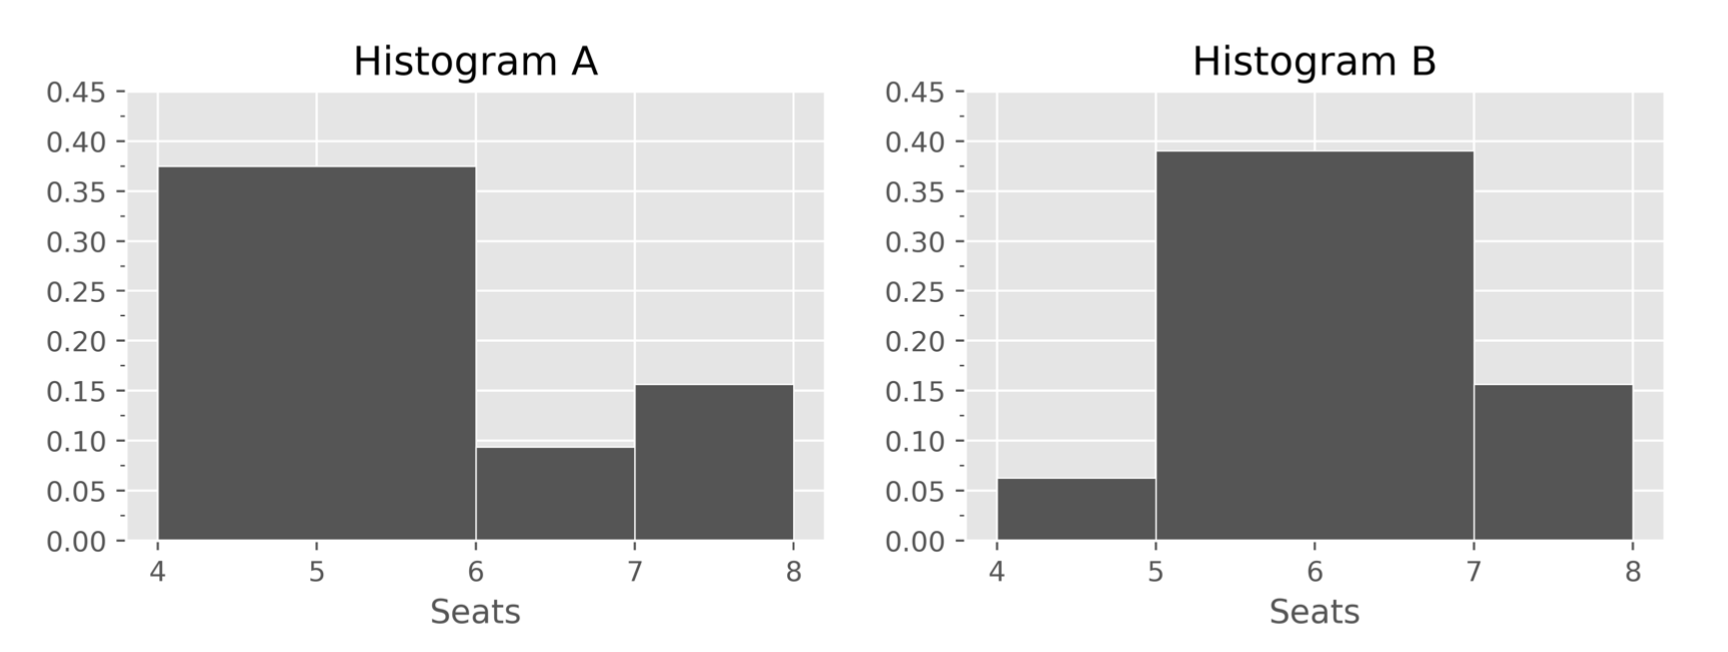
How many EVs in evs have exactly 6 seats?
Answer: 3
Here are two ways to solve this problem. In both solutions, we only
look at Histogram A, since only Histogram A contains a bin that
corresponds to EVs with exactly 6 "Seats". Recall, in
histograms, bins are inclusive of the left endpoint and exclusive of the
right endpoint, which means the [6, 7) bin represents EVs with >= 6
"Seats" and < 7 "Seats"; since the number
of "Seats" is a whole number, this corresponds to exactly 6
"Seats".
Solution 1
Since the bin [6, 7) has a width of 1, its height is equal to its area, which is equal to the proportion of values in that bin. There are 32 values total, so all proportions (and, thus, the height of the [6, 7) bar) must be a multiple of \frac{1}{32}. The height is close to but just under 0.01; this implies the height is \frac{3}{32}, since that is also close to but just under 0.01 (\frac{4}{32} is way above and \frac{2}{32} is way below). So, we conclude that the number of EVs with 6 seats is 3.
Solution 2
The height of the [6, 7) bar is ever-so-slightly less than 0.1. If it’s height was 0.1, it would imply that the proportion of values in the [6, 7) bin was 0.1 \cdot (7 - 6) = 0.1, which would imply that the number of values in the [6, 7) bin is 0.1 \cdot 32 = 3.2. However, since the number of values in a bin must be an integer, the number of values in this bin is 3 (which is slightly less than 3.2).
The average score on this problem was 61%.
How many EVs in evs have exactly 5 seats?
Answer: 22
Now, we must look at Histogram B. In the previous part, we computed
that there are 3 EVs with exactly 6 "Seats" in
evs. Histogram B shows us the proportion, and thus number,
of EVs with 5 or 6 "Seats", through its [5, 7) bin
(remember, this bin corresponds to EVs with >= 5 "Seats"
and < 7 "Seats"). If we can find the number of EVs with
5 or 6 "Seats", we can subtract 3 from it to determine the
number of EVs with exactly 5 "Seats".
Since it’s not quite clear what the height of the [5, 7) bar is, we can create a range for the height of the bar, and use that to come up with a range for the area of the bar, and hence a range for the number of values in the bin. We can then use the fact that the number of values in a bin must be an integer to narrow down our answer.
"Seats" is less than 0.8, and the number of EVs with 5 or
6 "Seats" is less than 0.8 \cdot
32 = 25.6."Seats" is more than 0.75 \cdot
32 = 24.We’ve found that the number of EVs with 5 or 6 "Seats"
is more than 24 and less than 25.6. There is only one integer in this
range – 25 – so the number of EVs with 5 or 6 "Seats" is
25. Finally, the number of EVs with exactly 5 seats is 25 - 3 = 22.
The average score on this problem was 35%.
Histogram C also displays the distribution of the
"Seats" column, but uses just a single bin, [4, 9]. What is
the height of the sole bar in Histogram C?
Answer: \frac{1}{5} (or 0.2)
Recall, the total area of a (density) histogram is 1. Since Histogram C only has one bar, the area of that one bar must be 1. we can use this fact to find what its height must be.
\begin{align*} \text{Area} &= \text{Width} \cdot \text{Height} \\ 1 &= (9 - 4) \cdot \text{Height} \\ \frac{1}{5} &= \text{Height} \end{align*}
The average score on this problem was 68%.